 Organic Workflow
 Peptide Workflow
 Scale-Up Flash Purification
  Sample Preparation
 Biomolecule Purification
 Oligo synthesis
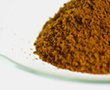 Scavengers and Reagents
 Service & Support
 Accessories & Spare parts
 Investors
 Reports & News
 The Share
 Corporate Governance
 Calendar
 Sustainability
 Our Offering
 Our History
 Our Locations
 Leadership
For my purification blog I often will synthesize compounds so I can show representative, real-world reaction product purification. In doing so, I decided I would also post on the impact of various synthesis variable. This post looks at the impact of reaction temperature time on an amide synthesis.
As I am sure you know, there are several variables in play when synthesizing a compound – scale, reaction solvent, reaction time, and reaction temperature. These variables can, and do, impact the crude reaction mixture’s chemical composition – product and by-products.
For this post I synthesized 2-amino-N-benzylbenzamide from isatoic anhydride and benzylamine in ethyl acetate (EtOAc) at 100 °C using a Biotage® Initiator+ microwave and varyied reaction times, Figure 1. Those reaction times were 2, 5, 10, and 15 minutes.
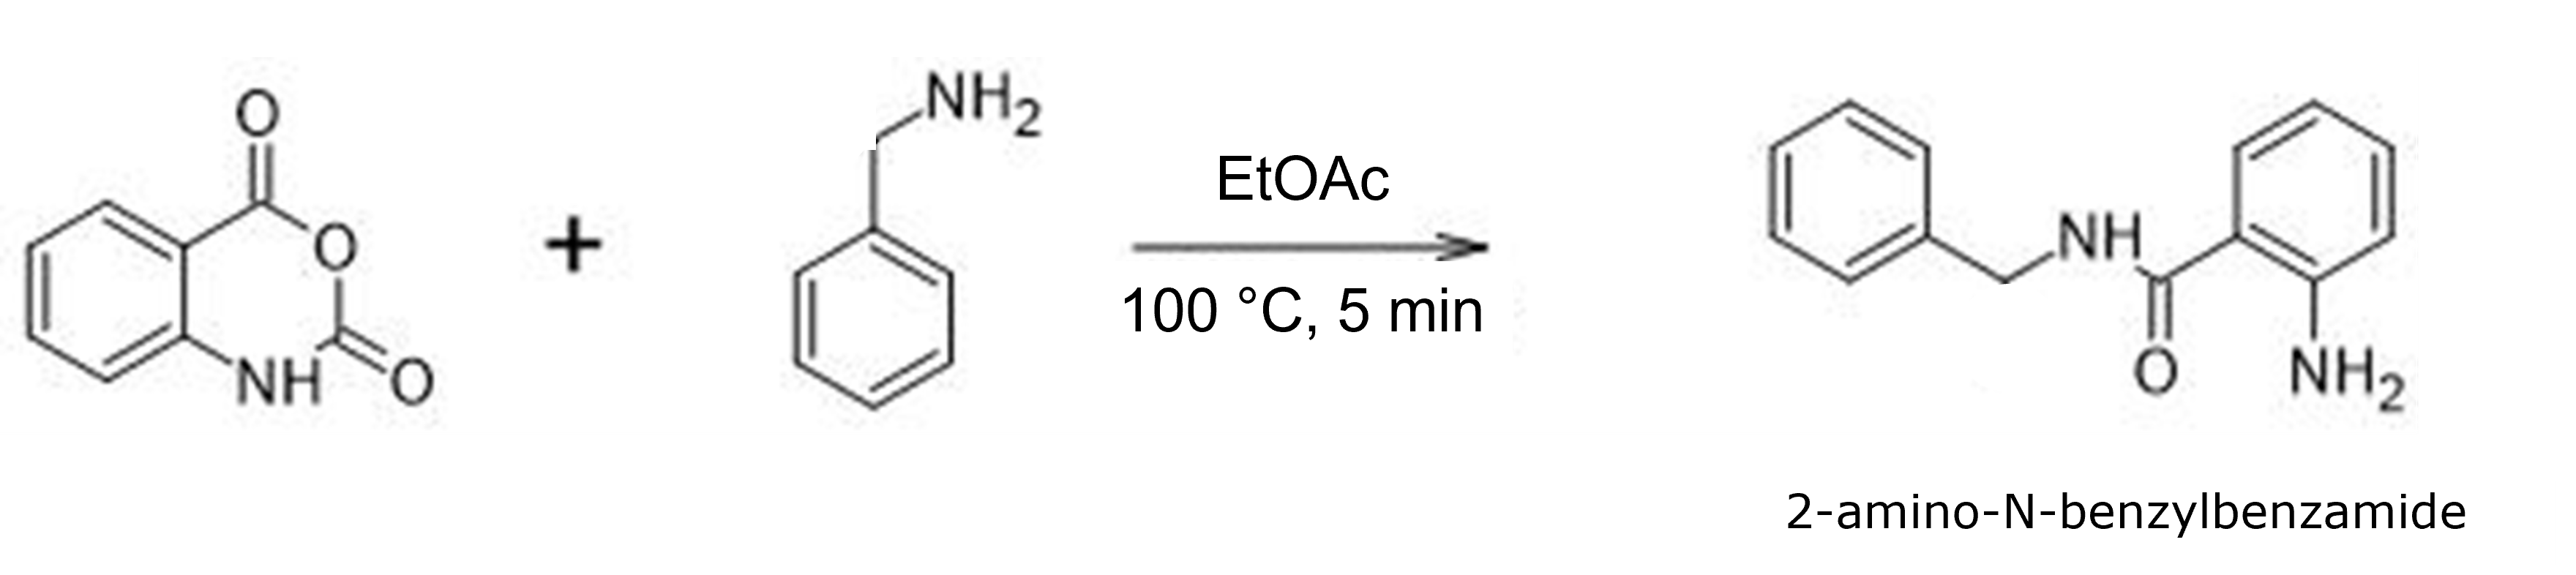
Figure 1. Synthetic reaction. Times ranged from 2 minutes to 15 minutes while reaction temperature, reagent concentration, and reaction solvent remained constant.
What I wondered was, what, if any, impact reaction time had on the number of generated by-products and my target product yields and purity. Previous studies I conducted at fixed reaction times with different temperatures and evaluating reagent order impact for this reaction, generated good yields of the product but created several by-products.
My first observation was that with increased reaction time in EtOAc, the reaction mix color became darker, a possible indicator of increased by-product generation, Figure 2.
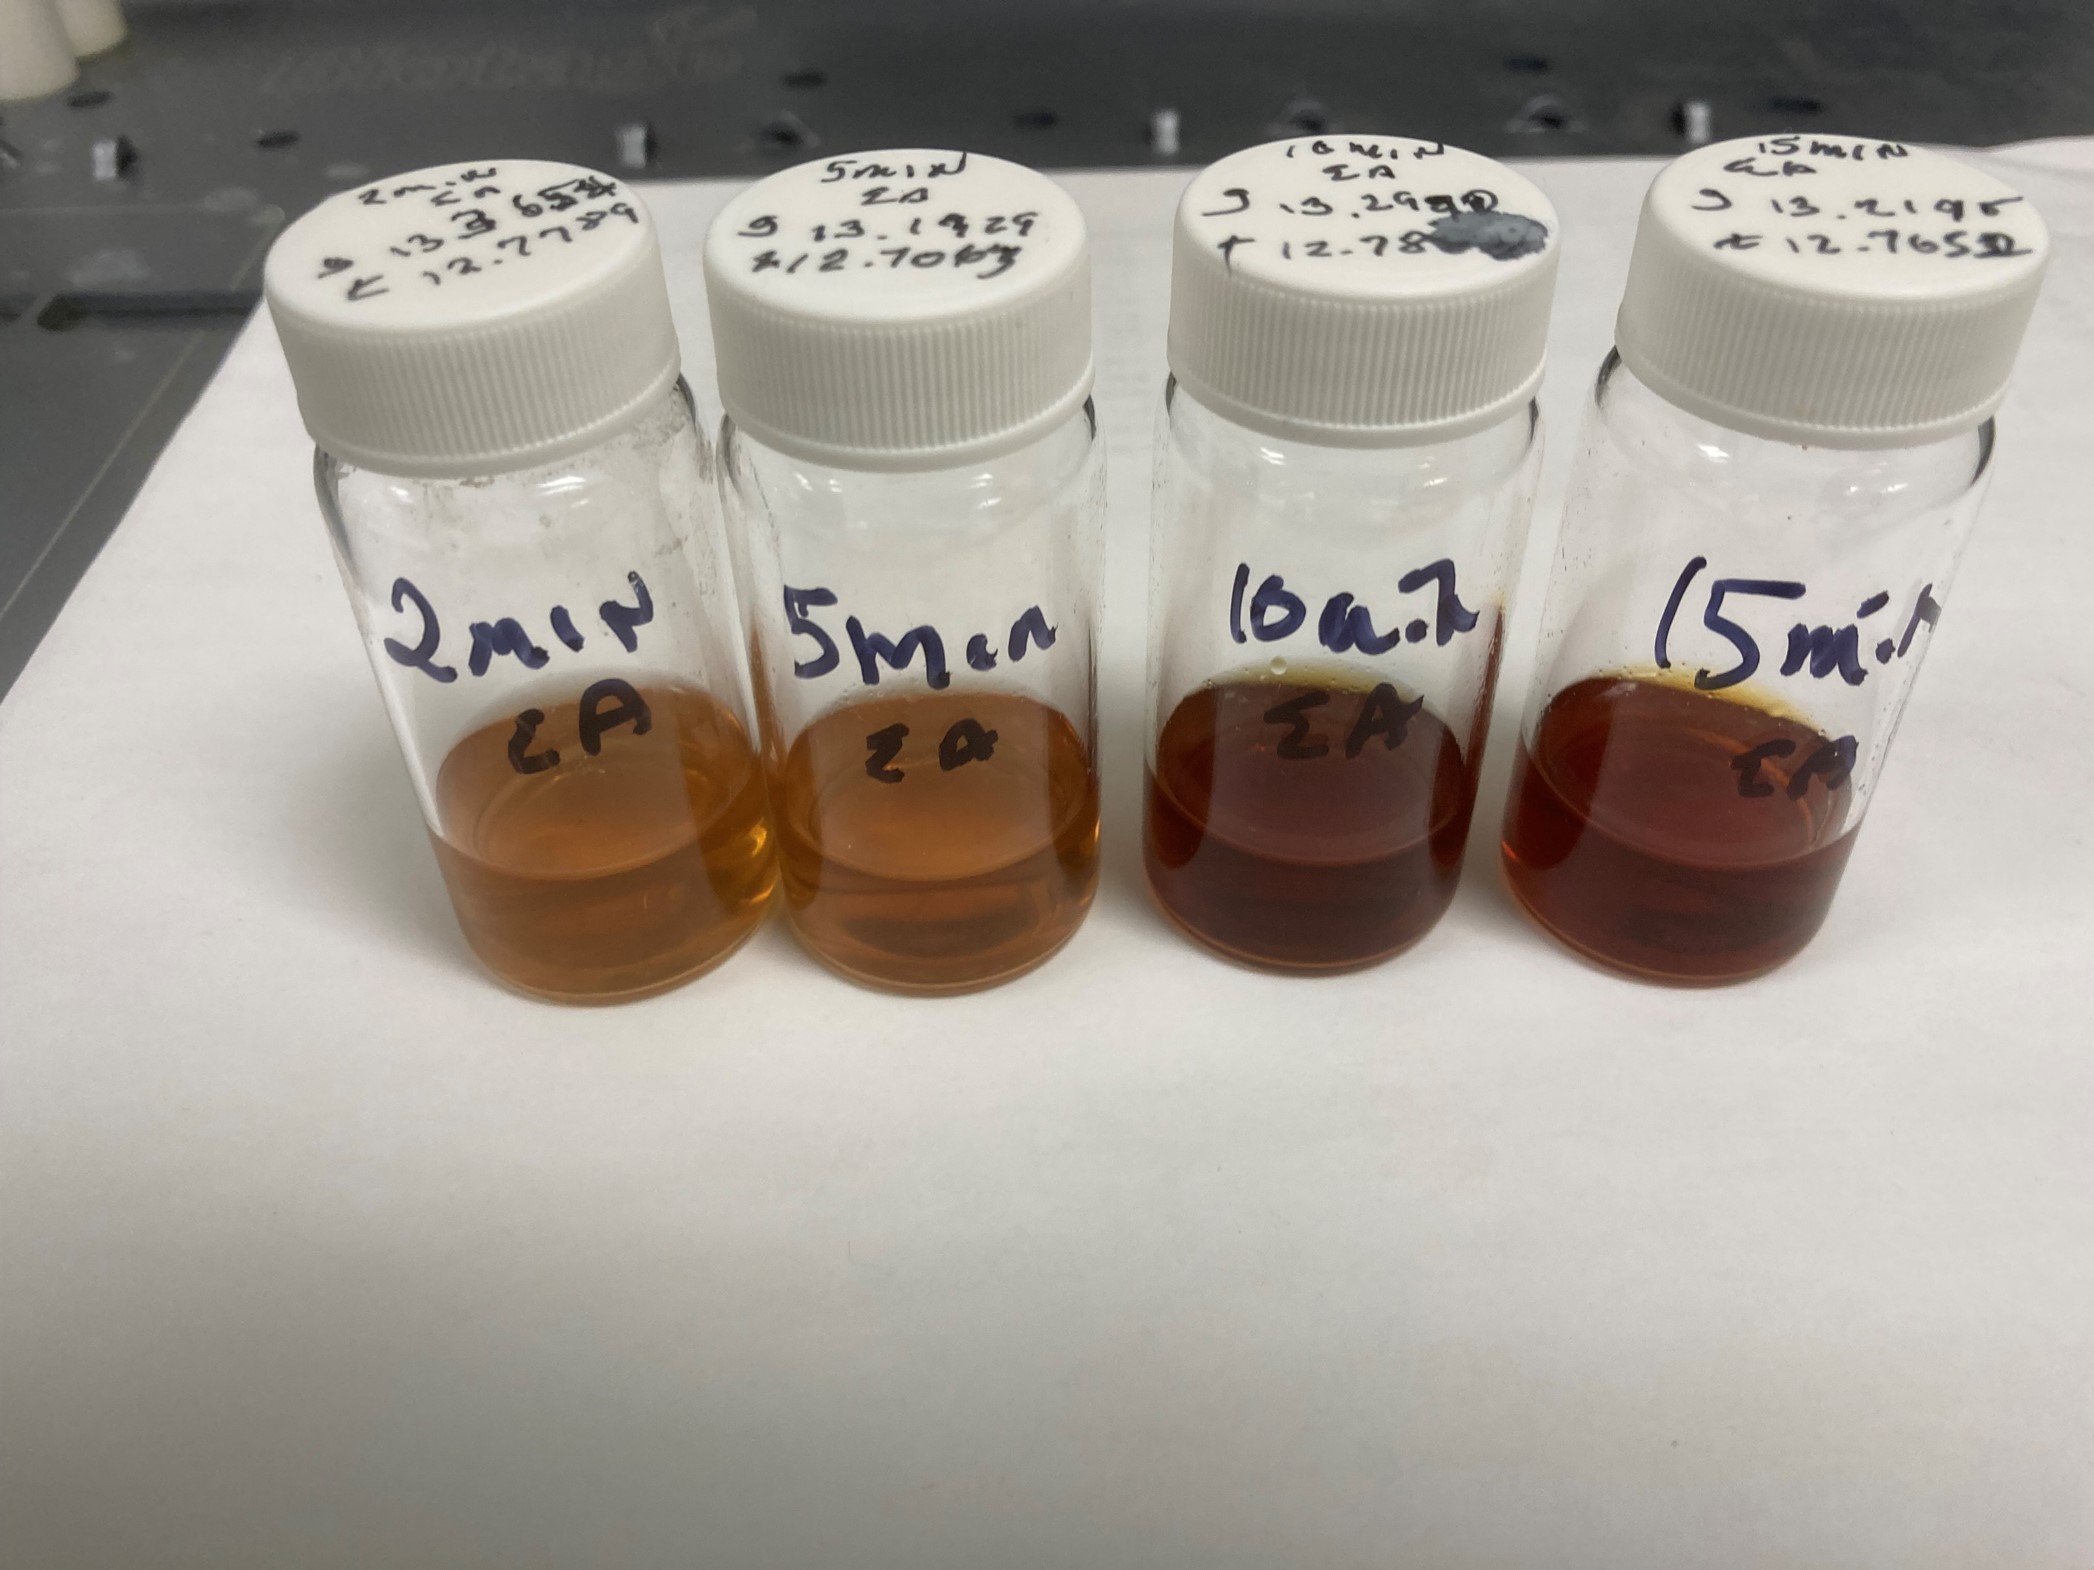
Figure 2. Reaction mixture darkened with increasing reaction time.
From previous experiments, I learned that neither normal-phase nor reversed-phase alone purified the product completely resulting in tan-colored products that should be white. So, for purification I used both techniques. This use of both normal- and reversed-phase flash chromatography is known as orthogonal flash chromatography, and is a purification technique which can maximize product purity without the need for expensive prep-HPLC.
Normal-phase purification
A gradient of 10% to 40% EtOAc in hexanes over 10 column volumes (CV) was used as my gradient with a 5-gram Biotage® Sfär HC column. These columns have quite high loading capacity so for each reaction I purified the entire mixture via dry loading (on silica). Loads ranged from 454 mg to 586 mg, Table 1. Quite high loads, but the idea was to clean-up the product and remove the lipophilic by-products so that reversed-phase flash could better purify the target compound.
Table 1. Reaction yield at various reaction times.

Normal-phase chromatography produced a separation of between 2 - 5 lower polarity by-products and two large, partially resolved peaks. With increasing reaction time, the number of by-products increased. As it turned out, my amide was in both the sharper peak at about 10 CV and the broader peak that follows, containing some by-product, Figure 3. These fractions were dried and weighed and provided yields between 253 and 308 mg of tan colored crystals, equivalent to between 43% and 64% of the crude load. Interestingly, though the number of by-products increased with reaction time, their total concentration in the mix diminished with increasing time leading to higher product yields with increased reaction time, Table 2.
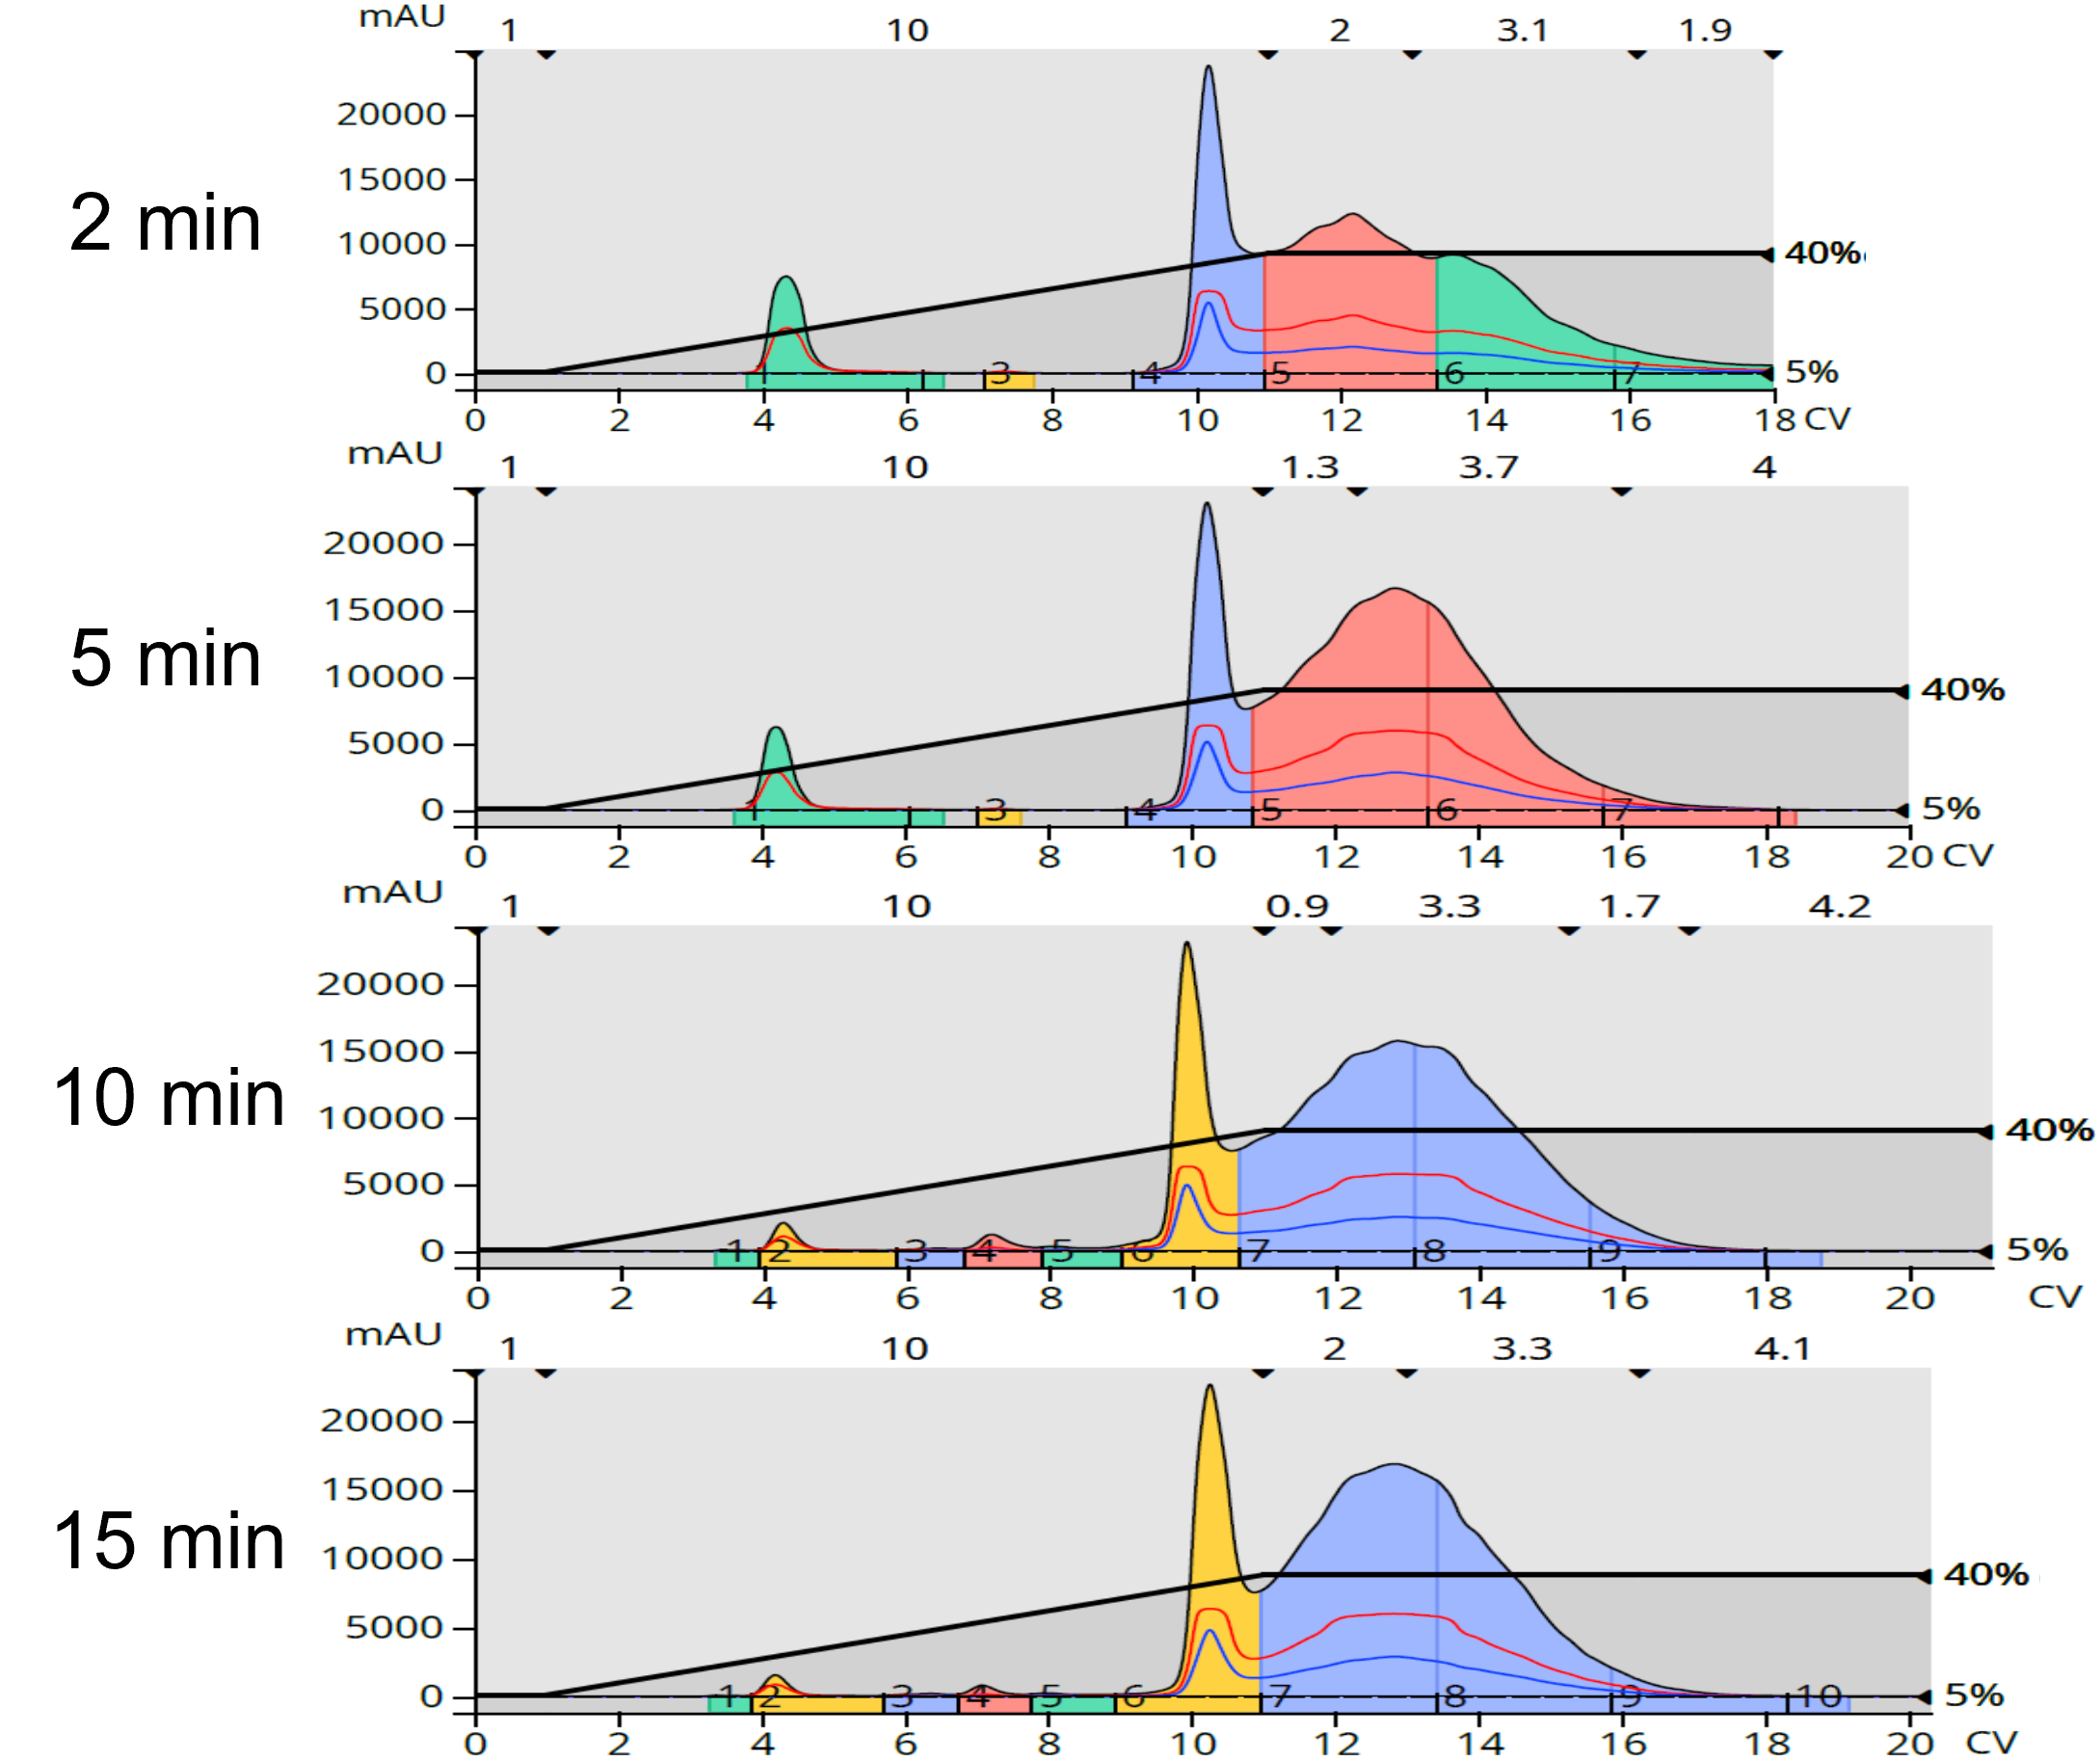
Figure 3. Reaction mixture purification using normal-phase flash chromatography showed an increase in the number lipophilic impurities with increasing reaction time.
Table 2. Reaction yields post purification by normal-phase flash chromatography.

After drying and redissolution in methanol, the four normal-phase product fractions from each reaction were re-purified using reversed-phase flash chromatography via dry load using a 12-gram Biotage® Sfär C18 column and a 35-85% MeOH/H2O gradient, Figure 4. The amount of purified product from reversed-phase was lower than from normal-phase, as one would expect from a second purification that removed even more by-products, Table 3.
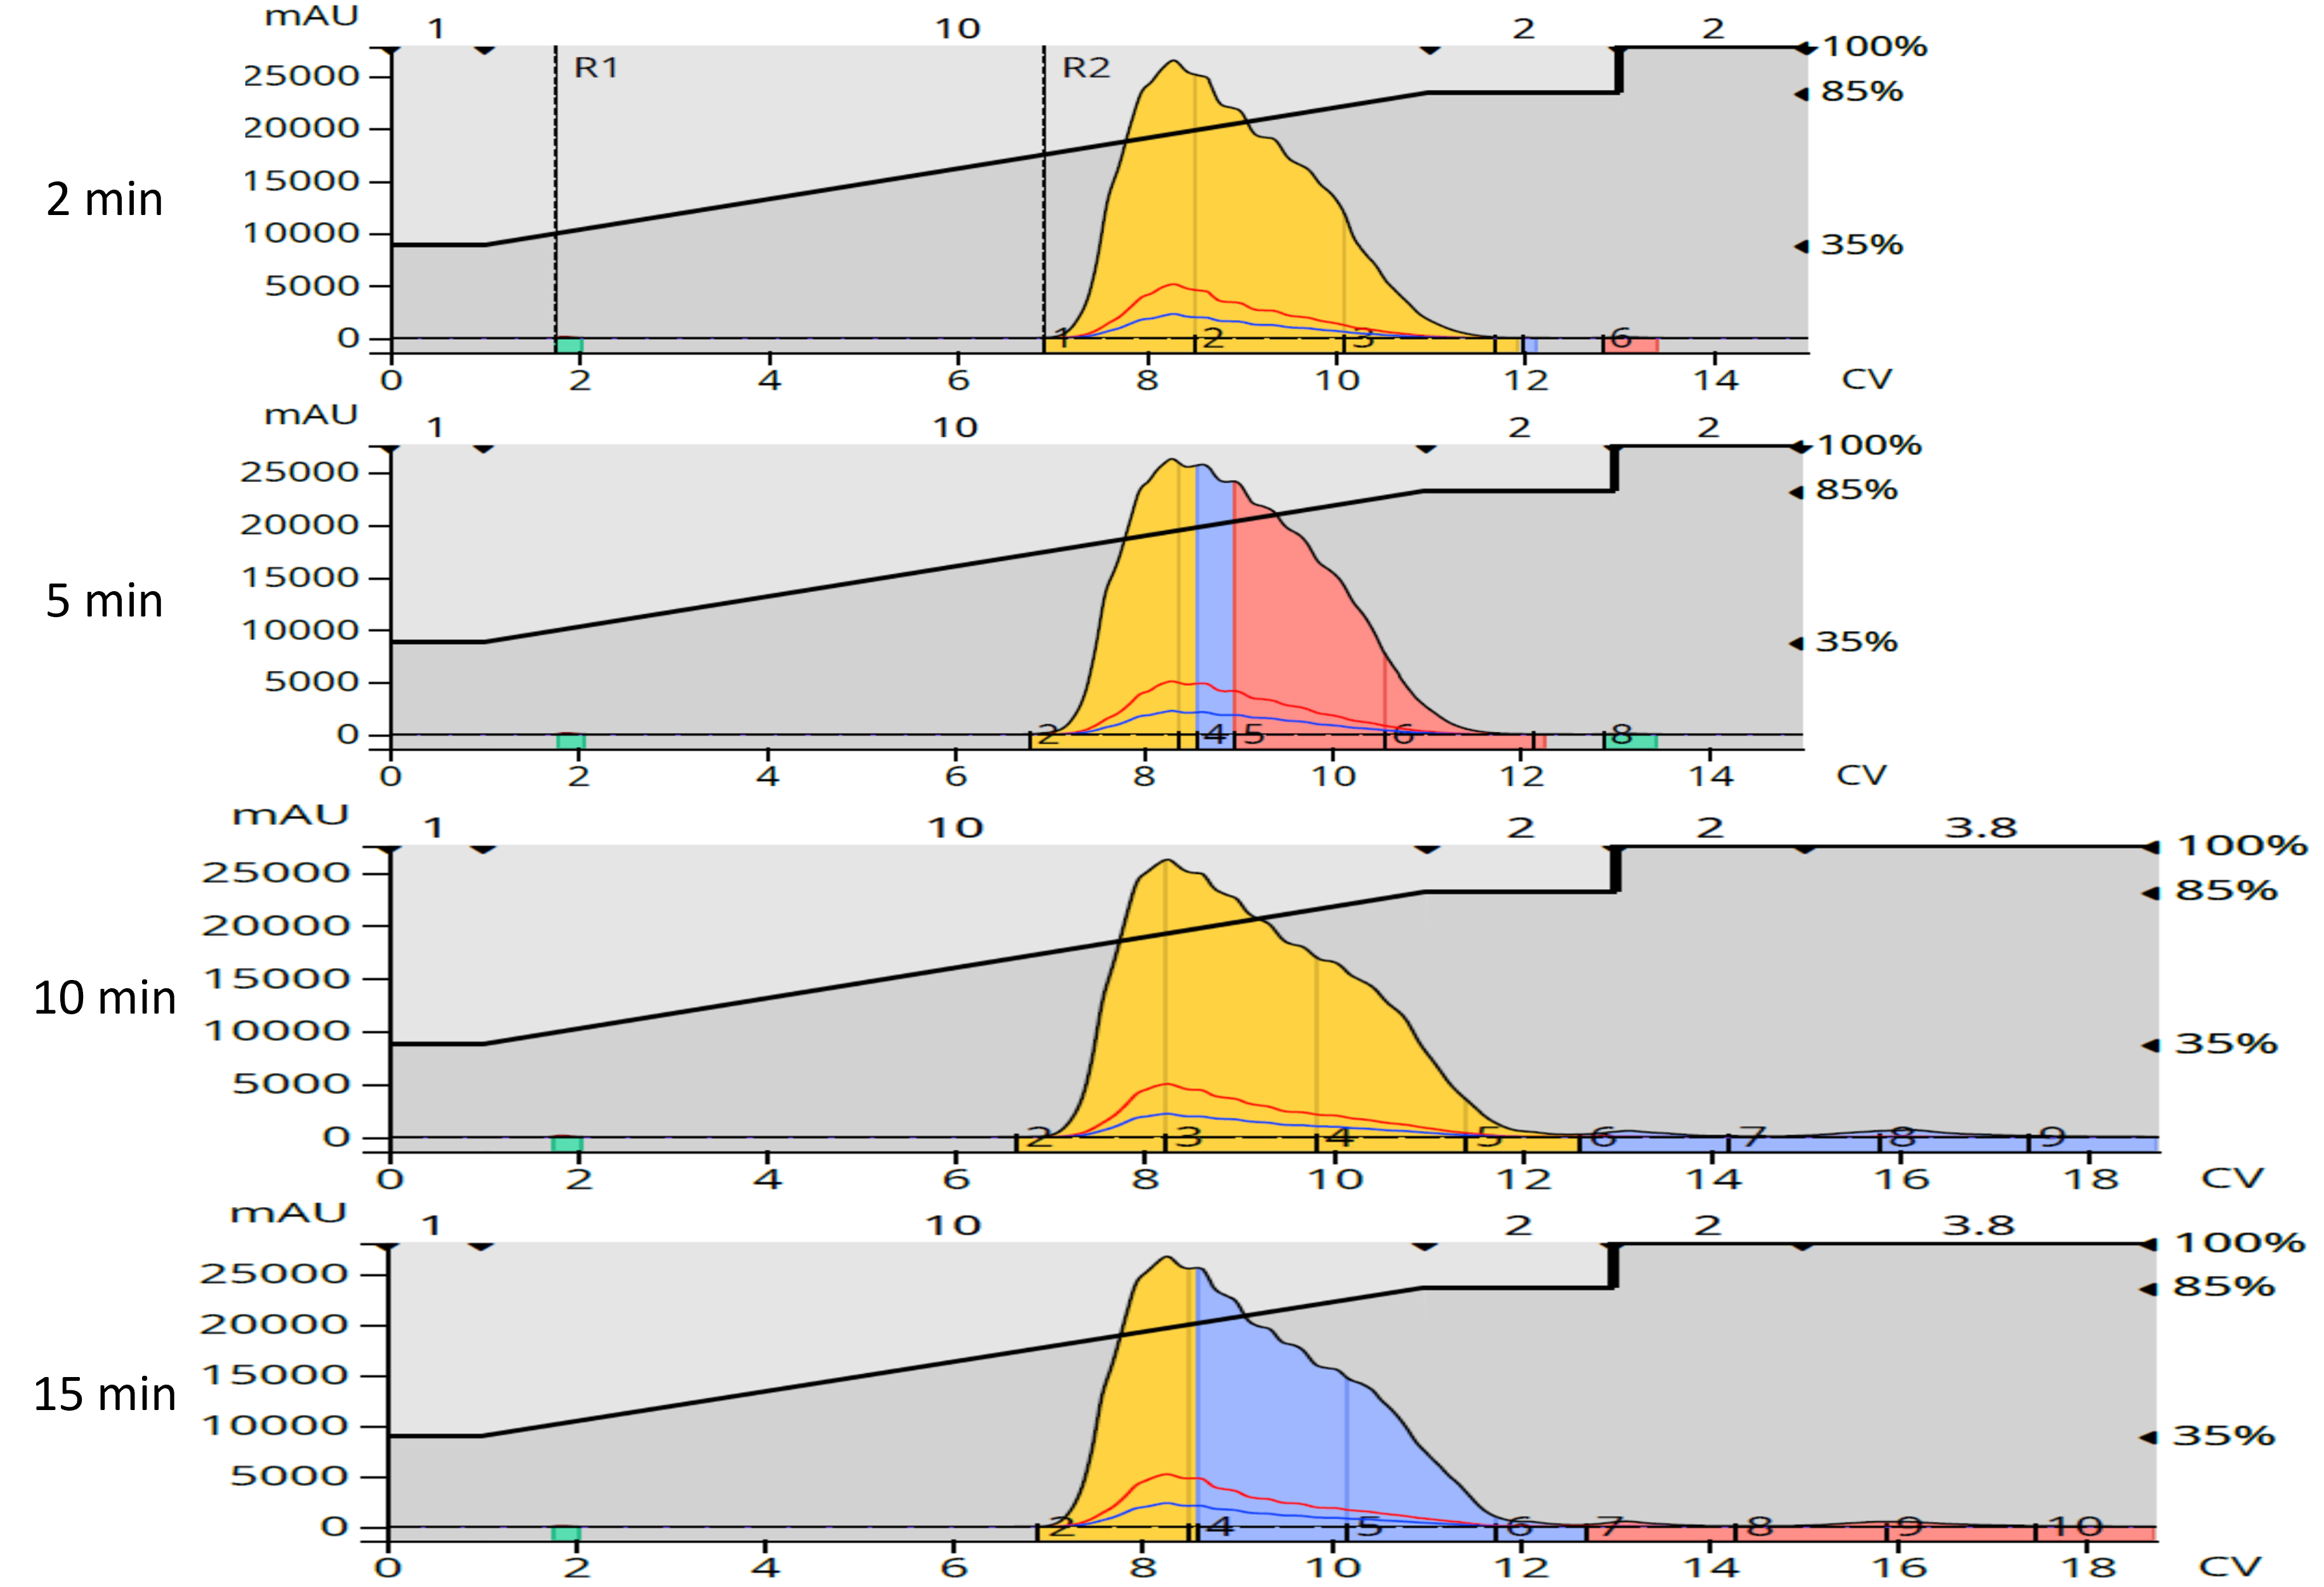
Figure 4. Reversed-phase purification of the normal-phase product fractions.
Table 3. Reversed-phase flash purification yields.

After redissolution in acetone, each reversed-phase purified fraction was chromatographically analyzed for purity, Figure 5.
What I saw was interesting – product purity was highest with the shorter reaction times, (2 and 5 minutes) which correlates with the color differences noted above and consistent with the normal-phase chromatograms showing that shorter reaction times created the most lipophilic (and easiest to remove) by-products, Table 4.
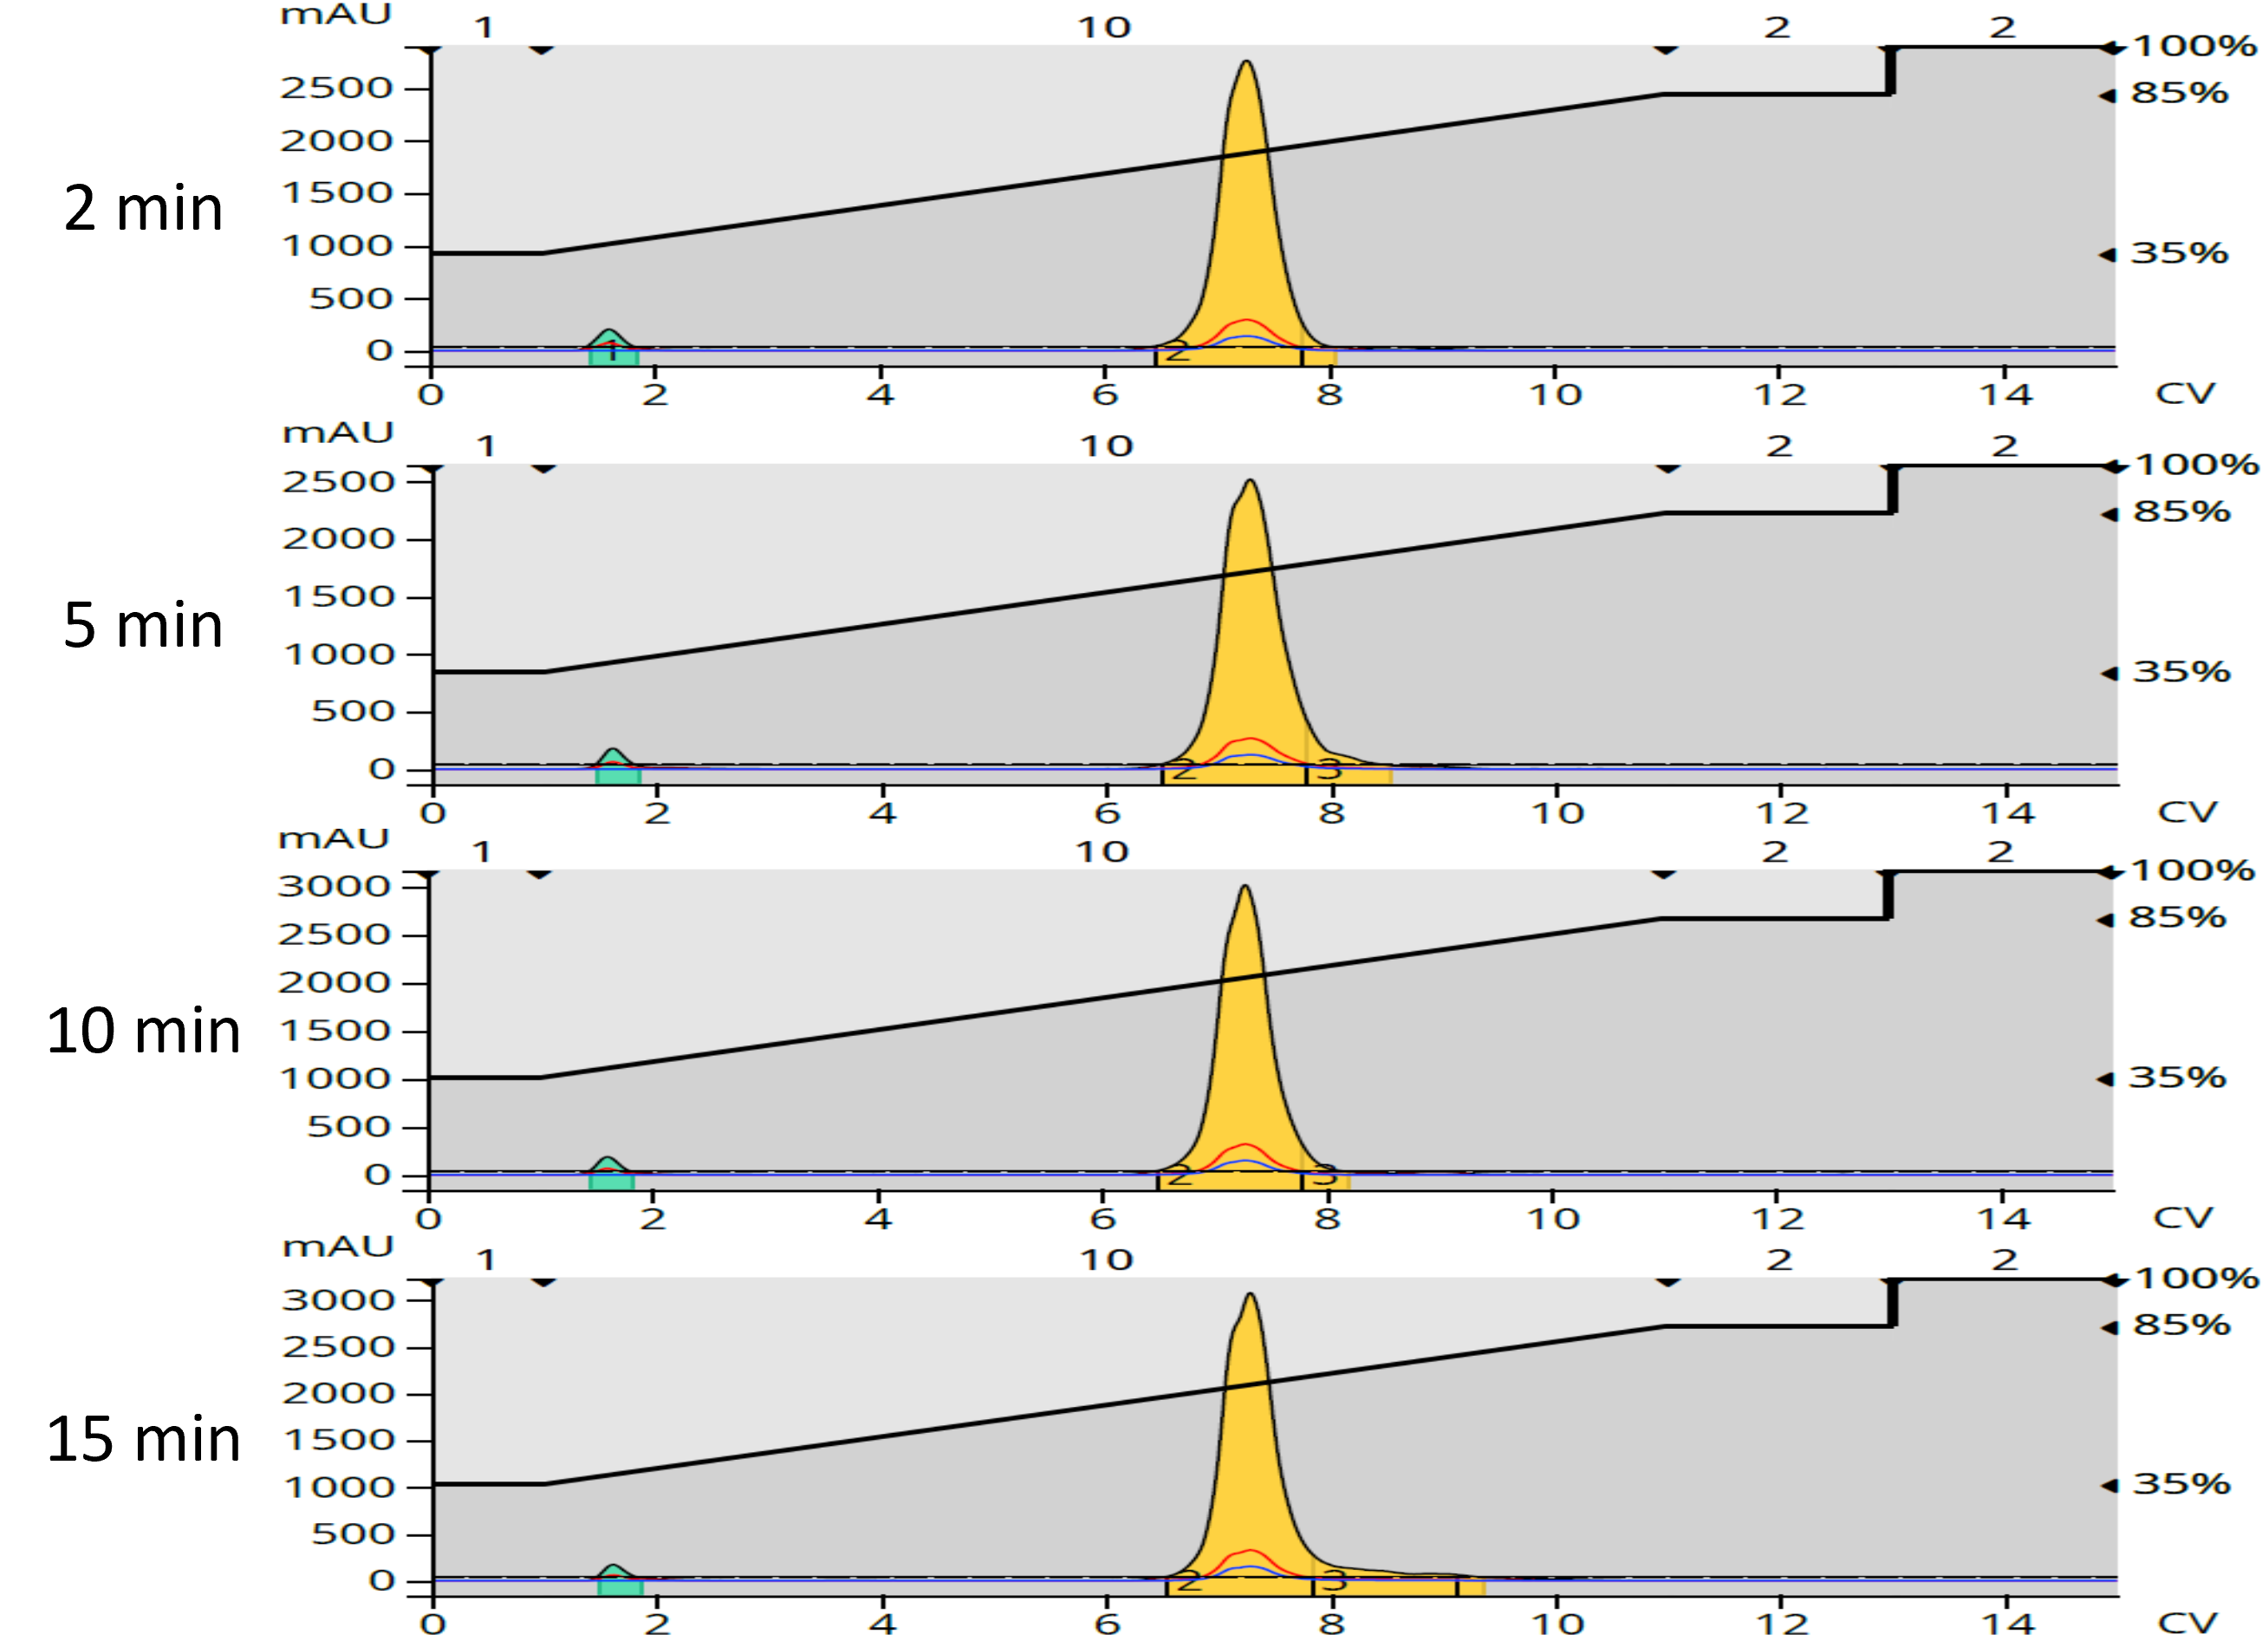
Figure 5. Reversed-phase purification fractions purity chromatograms. Purity was best with the 2 minute reaction. The small green peak is acetone, the sample solvent.
Table 4. Reversed-phase reaction purity by time.

So, yes reaction time can impact synthesis results as we have seen here. In this example, though product yield improved with time, its purity did not and was best with the shortest reaction time. Something to think about when you perform your next reaction.
For more information about microwave synthesis reactions, download our microwave reaction tutorial.