 Organic Workflow
 Peptide Workflow
 Scale-Up Flash Purification
  Sample Preparation
 Biomolecule Purification
 Oligo synthesis
 Scavengers and Reagents
 Service & Support
 Accessories & Spare parts
 Investors
 Reports & News
 The Share
 Corporate Governance
 Calendar
 Sustainability
 Our Offering
 Our History
 Our Locations
 Leadership
In this article I discuss the optimization of solvent ratios to generate ideal Rf (retention factor) values on TLC plates. Then I show how maximizing efficiency of flash chromatography achieves higher loading with rapid and reliable isolation of compounds, reduced solvent use and improved separation.
In a previous post I explored why choosing flash chromatography solvents based on their separation selectivity is important for effective purification of reaction products.
Here we will look at how to increase loading on a chromatographic column without compromising on effectiveness of purification.
Although a compound is resolved from the other compounds in the mix by TLC, its retention factor (Rf) and mass-transfer kinetics may not be optimal for good purification. That is because compound retention and mass-transfer kinetics are related to separation efficiency and, therefore, loading capacity.
When optimizing flash purification for component retention, TLC again is the most efficient tool for evaluating solvent ratios. Using the chosen solvent (or solvents) from the selectivity study, ratios of those solvents should be adjusted to get the targeted compound to an Rf of between 0.1 and 0.4, especially for isocratic purification. Rf, or retention factor, is the ratio of the distance a compound has moved on TLC divided by the distance the solvent traveled. Rf values range from 0 to 1.
Rf = compound migration distance/solvent migration distance
In flash chromatography, retention is expressed in column volumes (CV). A column volume is the space in a column or cartridge not occupied by the stationary phase.
It just so happens that the number of CV required to elute a compound isocratically using the solvent system used on TLC equals 1/Rf, quite simple! With this CV information you can determine the separation quality just by subtracting two adjacent compounds' 1/Rf or CV values. This generates a value known as delta CV (ΔCV) which is a measure of the amount of separation created. Larger ΔCV values suggest larger sample load are possible.
ΔCV = 1/Rf2 - 1/Rf1
or
ΔCV = CV2 - CV1
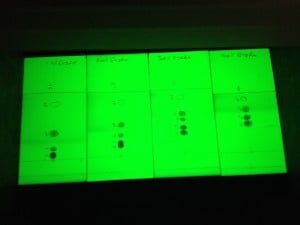
As an example, a 5-component mixture was separated on TLC using 10%, 20%, 30%, and 40% ethyl acetate in hexane. As seen in the photo above, compound migration distances and Rf values increase with the % of ethyl acetate. Based on the Rf range criteria mentioned previously (Rf 0.1-0.4), only the 10% and 20% ethyl acetate runs show a separation with suitable Rf values.
| 10% | 20% | 30% | 40% | |
| Migration distance | ||||
| 1 | 43 | 42 | 44 | 41 |
| 2 | 20 | 24 | 31 | 41 |
| 3 | 8 | 16 | 26 | 33 |
| 4 | 3 | 11 | 20 | 27 |
| 5 | 2 | 8 | 15 | 22 |
| Solvent Front (SF) | 52 | 50 | 51 | 46 |
| Retention Factor (Rf) | ||||
| 1 | 0.83 | 0.84 | 0.86 | 0.89 |
| 2 | 0.38 | 0.48 | 0.61 | 0.89 |
| 3 | 0.15 | 0.32 | 0.51 | 0.72 |
| 4 | 0.06 | 0.22 | 0.39 | 0.59 |
| 5 | 0.04 | 0.16 | 0.29 | 0.48 |
| Column Volumes (CV) | ||||
| 1 | 1.21 | 1.19 | 1.16 | 1.12 |
| 2 | 2.60 | 2.08 | 1.65 | 1.12 |
| 3 | 6.50 | 3.13 | 1.96 | 1.39 |
| 4 | 17.33 | 4.55 | 2.55 | 1.70 |
| 5 | 25.00 | 6.25 | 3.40 | 2.09 |
| ΔCV | ||||
| 1-2 | 1.39 | 0.89 | 0.49 | 0.00 |
| 2-3 | 3.90 | 1.04 | 0.32 | 0.27 |
| 3-4 | 10.83 | 1.42 | 0.59 | 0.31 |
| 4-5 | 8.67 | 1.70 | 0.85 | 0.39 |
Even having suitable Rf values, and therefore CV values, will not always translate into a good separation unless there is a suitable ΔCV. It is important to understand that the larger the ΔCV, the greater the loading for a particular mixture.
From the data above, we see compound 3 has suitable Rf values of 0.15 and 0.32 in 10% and 20% ethyl acetate, respectively. Though the Rf values convert to CV values of 6.5 and 3.13, we need to look at how well separated compound 3 (our target in this case) is from compounds 2 and 4. What we see from the table above is at 10% ethyl acetate, compound 3 has a ΔCV of 3.90 vs. compound 2 and ΔCV 10.83 vs. compound 4. In 20% ethyl acetate however, the ΔCV values are much smaller (1.04 and 1.42, respectively) which does limit our loading capacity. Loading is based on the smaller of the ΔCV values. With a ΔCV of 3.9, we should be able to load between 100 and 500 mg on a 10g silica cartridge but with a ΔCV of 1.04, we are limited to less than a 100 mg load.
In the chromatograms below, isocratic flash runs with 10% and 20% ethyl acetate with a 100 mg loading confirms the load predictions based on ΔCV to be accurate. In 20% ethyl acetate we have poor separation between all of the peaks while in 10% we achieve a complete separation, especially for peak 3.
 Flash separation using a 10 g Biotage(R) SNAP cartridge at 10% EtOAc fully resolves each compound at a 100 mg load.
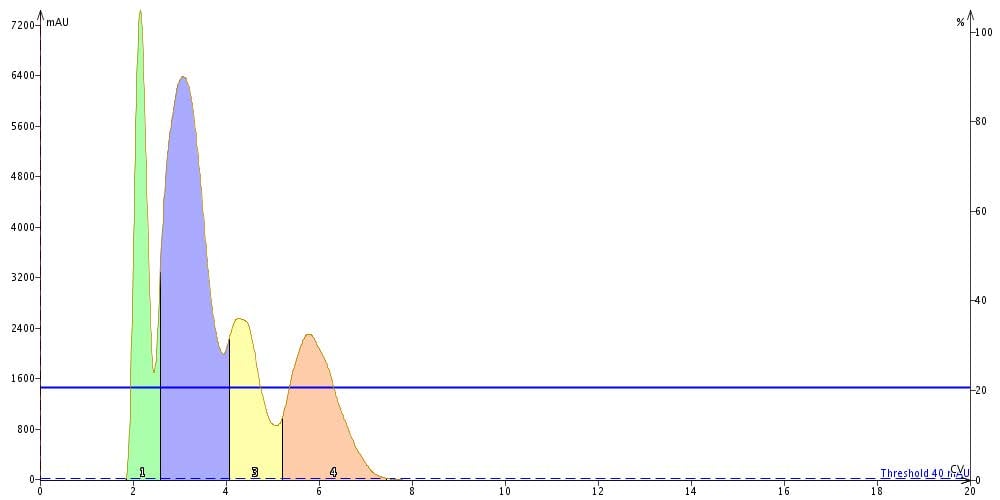
Flash separation of 100 mg load at 20% EtOAc shows the 10 g cartridge is overloaded due to the low delta CV between compounds.
So, just obtaining a separation on TLC is not enough to take that method to flash; you need to get your targeted compound in the proper Rf range.
Try this and share your results.
If you're interested in learning more about how to be successful in flash chromatography, download the white paper!