 Organic Workflow
 Peptide Workflow
 Scale-Up Flash Purification
  Sample Preparation
 Biomolecule Purification
 Oligo synthesis
 Scavengers and Reagents
 Service & Support
 Accessories & Spare parts
 Investors
 Reports & News
 The Share
 Corporate Governance
 Calendar
 Sustainability
 Our Offering
 Our History
 Our Locations
 Leadership
Automated flash chromatography systems have helped synthetic chemists speed up their synthetic research. One major advancement with these systems over the past 15 or so years has been the addition of photo-diode array ultraviolet (PDA-UV) UV detectors with which chemists can detect and fractionate using one, two, or multiple wavelengths. Enabling detection and fractionation with multiple wavelengths increases the likelihood that target and by-product compounds will be isolated with increased purity.
Some flash systems, such as those from Biotage (Biotage® Selekt and Isolera), offer optional, full spectrum, aka all-wavelength, detection. With this capability, detection wavelength ranges can be optimized to enhance sensitivity for virtually any compound, including those with a low extinction co-efficient and/or low λ-max wavelength.
So, with this enhanced sensitivity, what is its impact on both fractionated compound purity and recovered yield? The answer, at least based on some preliminary work I have just completed with a single sample mixture, is that recovered yield and fraction purity are not impacted positively or negatively.
How I determined this was by creating a four component mixture (1 gram each dissolved in acetone to a volume of 10 mL), developing a TLC separation in 20% ethyl acetate/hexane, and using the Rf data to create a linear gradient (5-40% over 10 column volumes (CV)) that also estimates a maximum sample load targeting a single compound, Table 1. My target compound for this exercise was 3,5-dibenzyloxyacetophenone and my purification column was a 10-gram Biotage® Sfär HC.
Table 1. TLC elution data in 80:20 Hexane/Ethyl acetate.
| Compound | Rf | CV | ΔCV | Load (mg) |
| Naphthalene | 0.83 | 1.20 | ||
| 1-Nitronaphthalene | 0.57 | 1.75 | ||
| 3,5-dibenzyloxyacetophenone | 0.43 | 2.33 | 0.58 | 786 |
| Ethyl paraben | 0.26 | 3.85 | 1.52 |
With a sample concentration of 400 mg/mL, an injection volume of nearly 2-mL was required to achieve the estimated load of 786 mg. An injection volume that large on a 10-gram column, with a 15 mL CV, is equivalent to 13.3% of the column’s volume – way too large to achieve a successful separation in most cases. The alternative was to dry load, which eliminated the sample solvent’s negative impact on chromatography (diffusion, dispersion, dilution, band-broadening).
For dry loading, I added 2 mL of sample (800 mg) to 3 grams of silica (Biotage® KP-Sil). This is a sample/sorbent ratio of ~1:4. Ideal dry load ratios are between 1:3 and 1:4.
The sample/sorbent combination was mixed and then dried using the Biotage® V-10 Touch solvent evaporation system. After drying, the sorbent was transferred to a 10-gram capacity Biotage® Sfär DLV (dry load vessel) which was attached to the top of my 10-gram Sfär HC column after equilibration.
Two separate dry loads were prepared and purified. The first purification using all-wavelength (200-400 nm) collection and the second using 254 nm (the wavelength used with TLC detection). In both cases, the fractionation threshold (trigger setting to begin collection) was set to 40 mAU. The Selekt system’s valley sensing capability provided fractionation for peaks not fully resolved.
The resulting chromatography showed a good separation between the target compound and it nearest eluting impurities, regardless of wavelength choice, Figure 1.
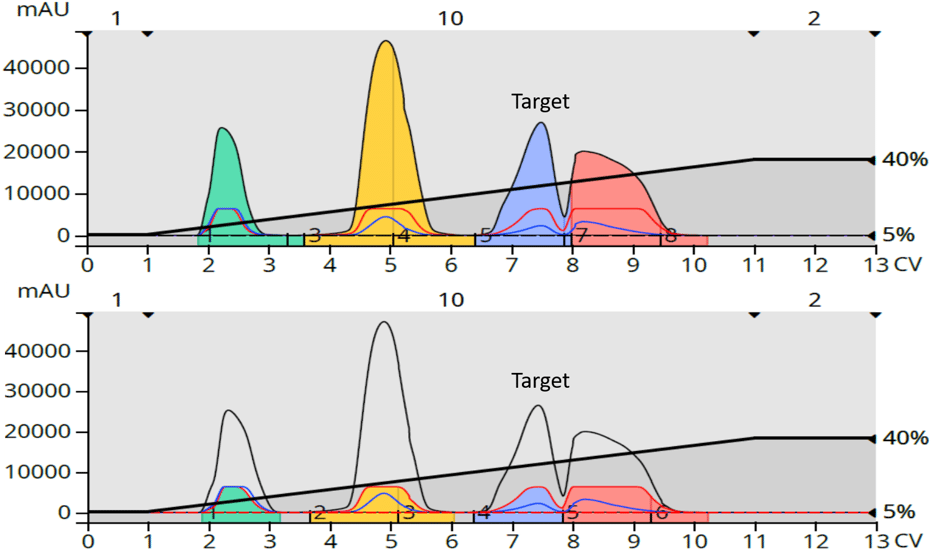
Figure 1. 800 mg load purification results with fractionation triggered by different detection wavelengths. Top - λ-all (200-400 nm). Bottom - 254 nm.
With both purifications, the third eluting peak was evaporated into a tared vial to determine recovery yield. Since the sample is a mix of four compounds with equal weights, each peak should yield ~200 mg, which is what was recovered for both purifications, Table 2.
Table 2. Recovered mass at different detection wavelengths.
| Wavelength (nm) | Yield (mg) |
| 254 | 205 |
| 200-400 | 212 |
Fraction purity was determined using the Selekt and a reversed-phase C18 Sfär column (12-gram) with a water/methanol gradient. For this test, the dried fraction was dissolved in 1 mL of DMSO from which 0.1 mL was purified, Figure 2.
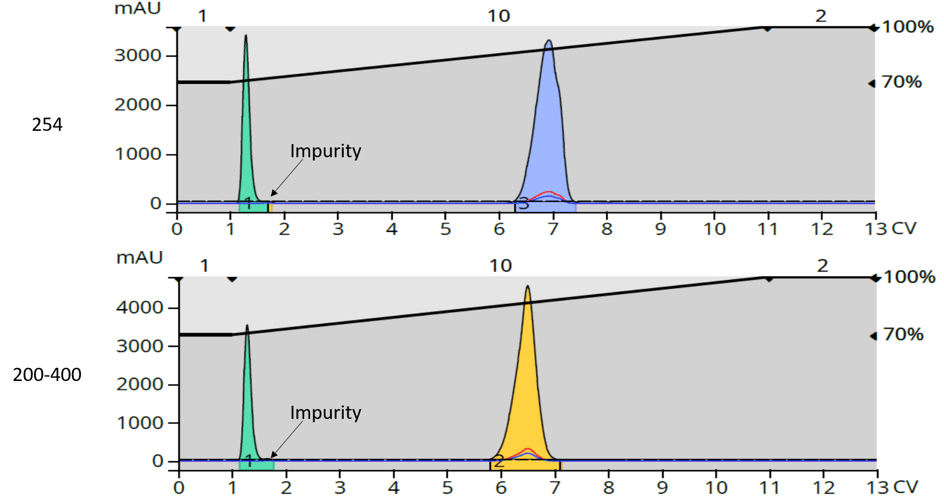
Figure 2. Target compound purity assessment. Top - 254 nm fractionation. Bottom - 200-400 nm fractionation. In both cases a very minor impurity is present eluting just after the DMSO peak (green).
Using peak height ratios (product + impurity, excluding DMSO), the isolated product purity for both purifications was 98.6%, Table 3.
Table 3. Isolated product purity analysis
| Wavelength (nm) | Product height (mAU) | By-product height (mAU) | Total retained peak height (mAU) | % Purity | Recovered mass (mg) | Yield (mg) |
| 254 | 3320 | 47 | 3367 | 98.6 | 209 | 206 |
| 200-400 | 4570 | 61 | 4631 | 98.6 | 212 | 209 |
So, there does not appear to be any recovery or purity differences based on detection with a single wavelength or a wavelength range.
Thirsty for more flash chromatography tips and tricks? Check our our whitepaper - Successful Flash Chromatography.