 Organic Workflow
 Peptide Workflow
 Scale-Up Flash Purification
  Sample Preparation
 Biomolecule Purification
 Oligo synthesis
 Scavengers and Reagents
 Service & Support
 Accessories & Spare parts
 Investors
 Reports & News
 The Share
 Corporate Governance
 Calendar
 Sustainability
 Our Offering
 Our History
 Our Locations
 Leadership
As chemists, our job is to make new molecules. If our synthetic design works as planned, we will have success and the target product made. As we all know, along with our desired compound, by-products are often created as well. To remove the by-products, the reaction mixture requires purification, typically with flash chromatography.
To know that your synthesis was successful, the reaction mixture must be analyzed. The most common tools for this are thin-layer chromatography (TLC) and high-performance liquid chromatography, often with mass detection (HPLC-MS).
While mass detection will verify the molecular weight of the synthetic product, that information does not help when purifying with typical UV detection-based flash chromatography other than potentially providing an estimated retention/elution volume.
Flash systems equipped with scanning photo-diode array (PDA-UV) detectors save and display each detected compound’s UV spectrum. This information can be helpful when purifying the reaction mixture, especially if the product peak is not gaussian, shows a shoulder, or has a potential, partially resolved impurity.
I can relate to this with my normal-phase purification of the microwave reaction in Figure 1.
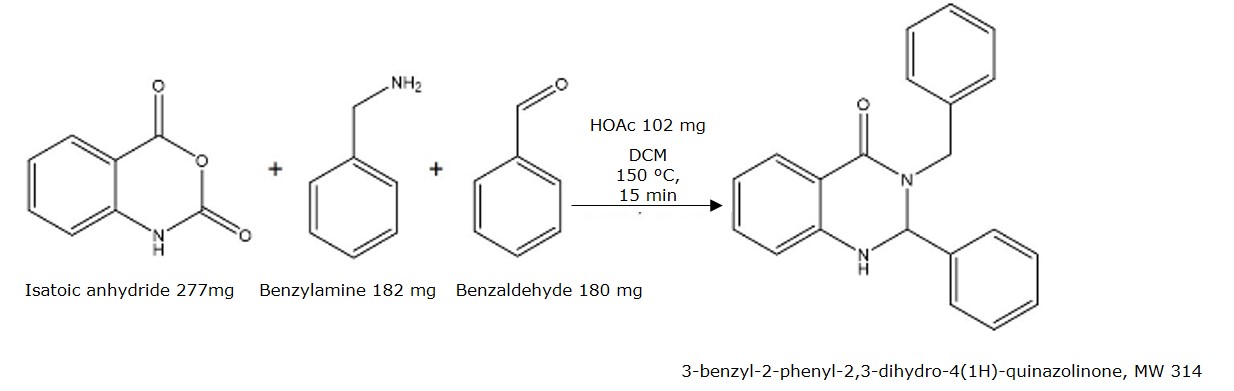
Figure 1. Reaction of isatoic anhydride, benzylamine, and benzaldehyde in DCM with acetic acid.
While the reaction made the desired product, it also created two by-products, one which eluted on the product's tail when purified by flash chromatography, Figure 2.
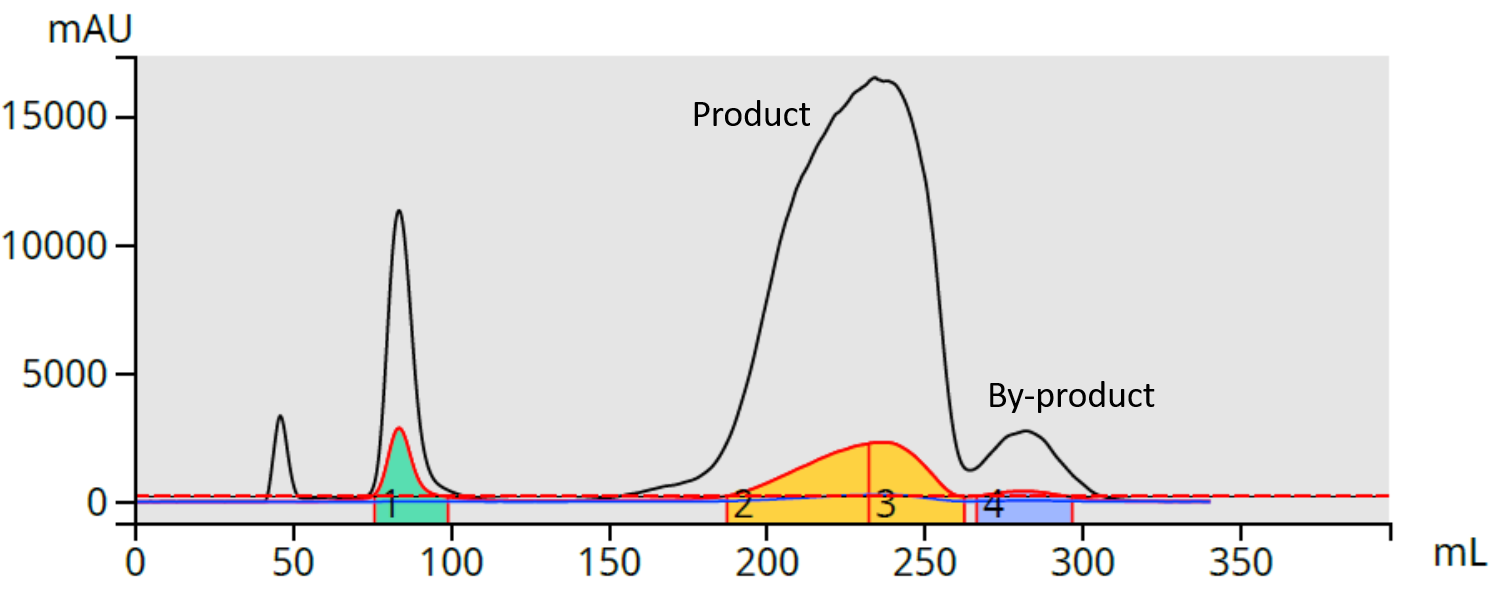
Figure 2. Flash purification of reaction mixture (400 mg, 25 gram Biotage Sfar HC silica column).
While baseline separation was achieved, the product peak did not elute in a typical gaussian shape indicating either possible mass transfer kinetics anomalies or the presence of one or more co-eluting by-products.
Since my Biotage® Selekt flash system has scanning PDA, I was able to check the product peak’s spectral purity by looking at its spectrum at different locations in the peak, Figure 3.
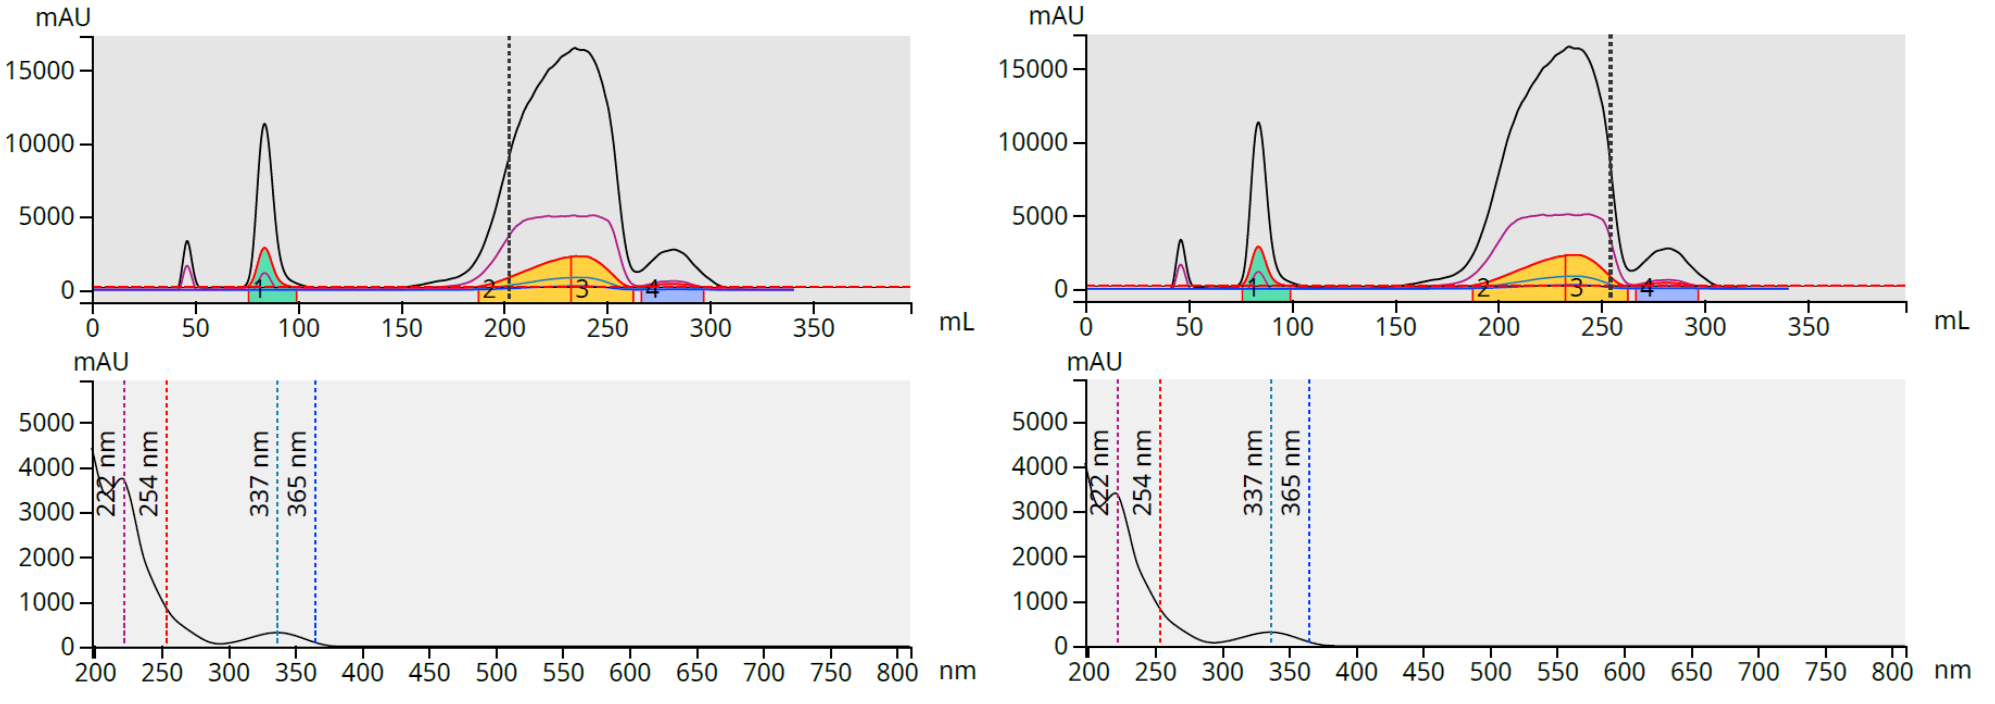
Figure 3. Product UV spectrum analysis at the peak's front (left) and back (right) are identical indicating high purity.
The product purity was further validated by mass spectral analysis (Biotage Dalton 2000) of the combination of fractions 2 and 3, Figure 4.
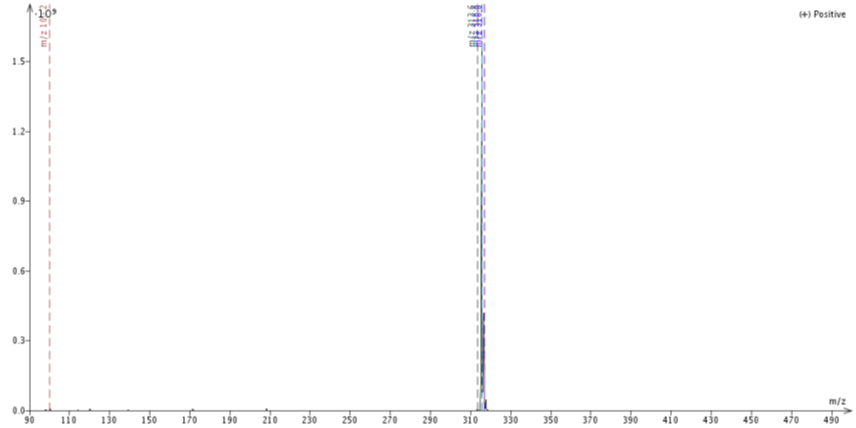
Figure 4. Product peak mass analysis show only the product mass, +m/z 315 as the M+H.
UV spectra analysis using your flash purification system provides compound purification success guidance as well as potential compound identification.
For more information on flash chromatography, please download our whitepaper - Inspiring Productivity with Modern Flash Chromatography.