 Organic Workflow
 Peptide Workflow
 Scale-Up Flash Purification
  Sample Preparation
 Biomolecule Purification
 Oligo synthesis
 Scavengers and Reagents
 Service & Support
 Accessories & Spare parts
 Investors
 Reports & News
 The Share
 Corporate Governance
 Calendar
 Sustainability
 Our Offering
 Our History
 Our Locations
 Leadership
I often get questions from customers about the influence of flow rate on their flash chromatography. Typically, the questions are…
- -If I slow the flow rate will my separation improve?
- -If I speed the flow rate will my separation improve and finish sooner?
-In this post I will answer both questions.
In past posts I have discussed the influence of linear velocity on the chromatographic separation, especially in regard to purification scale-up. Flow rate impacts linear velocity which influences mass transfer kinetics and the separation, regardless of column size.
For every particle size media, there is an optimal linear velocity, Figure 1. The larger the particle size the lower the optimal linear velocity, or flow rate.
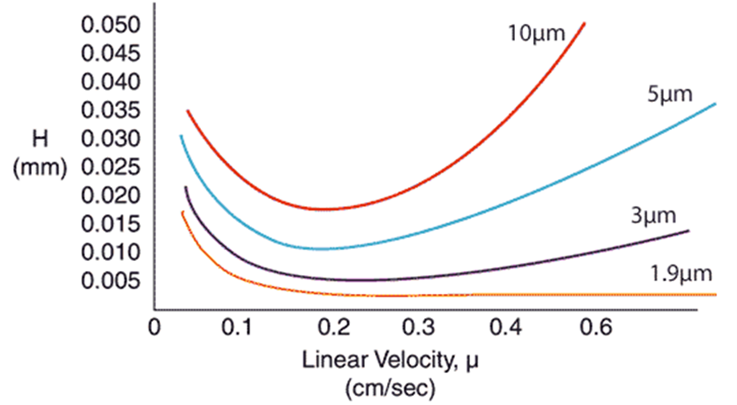
Figure 1. Linear velocity impact on separation performance and indicated by H, or height equivalent to a theoretical plate. Smaller particles have larger optimal linear velocities and are impacted less by increased flow rate.
Flash chromatography columns are packed with larger particle size media than that in Figure 1 meaning that straying from the optimal flow can have serious consequences on the purification quality. But what does this translate to in regard to reality? Do I need to have the flow rate set precisely to the optimal conditions? How much leeway is there?
Well, I decided to see for myself, using a 12-gram Biotage® Sfär C18 column and a two-component sample. I performed the same separation using the same method but changed flow rate starting at 20 mL/min and ending at 50 mL/min. The results indicated that, at least with this easy separation, flow rate (linear velocity) really had little impact on the separation, Figure 2.
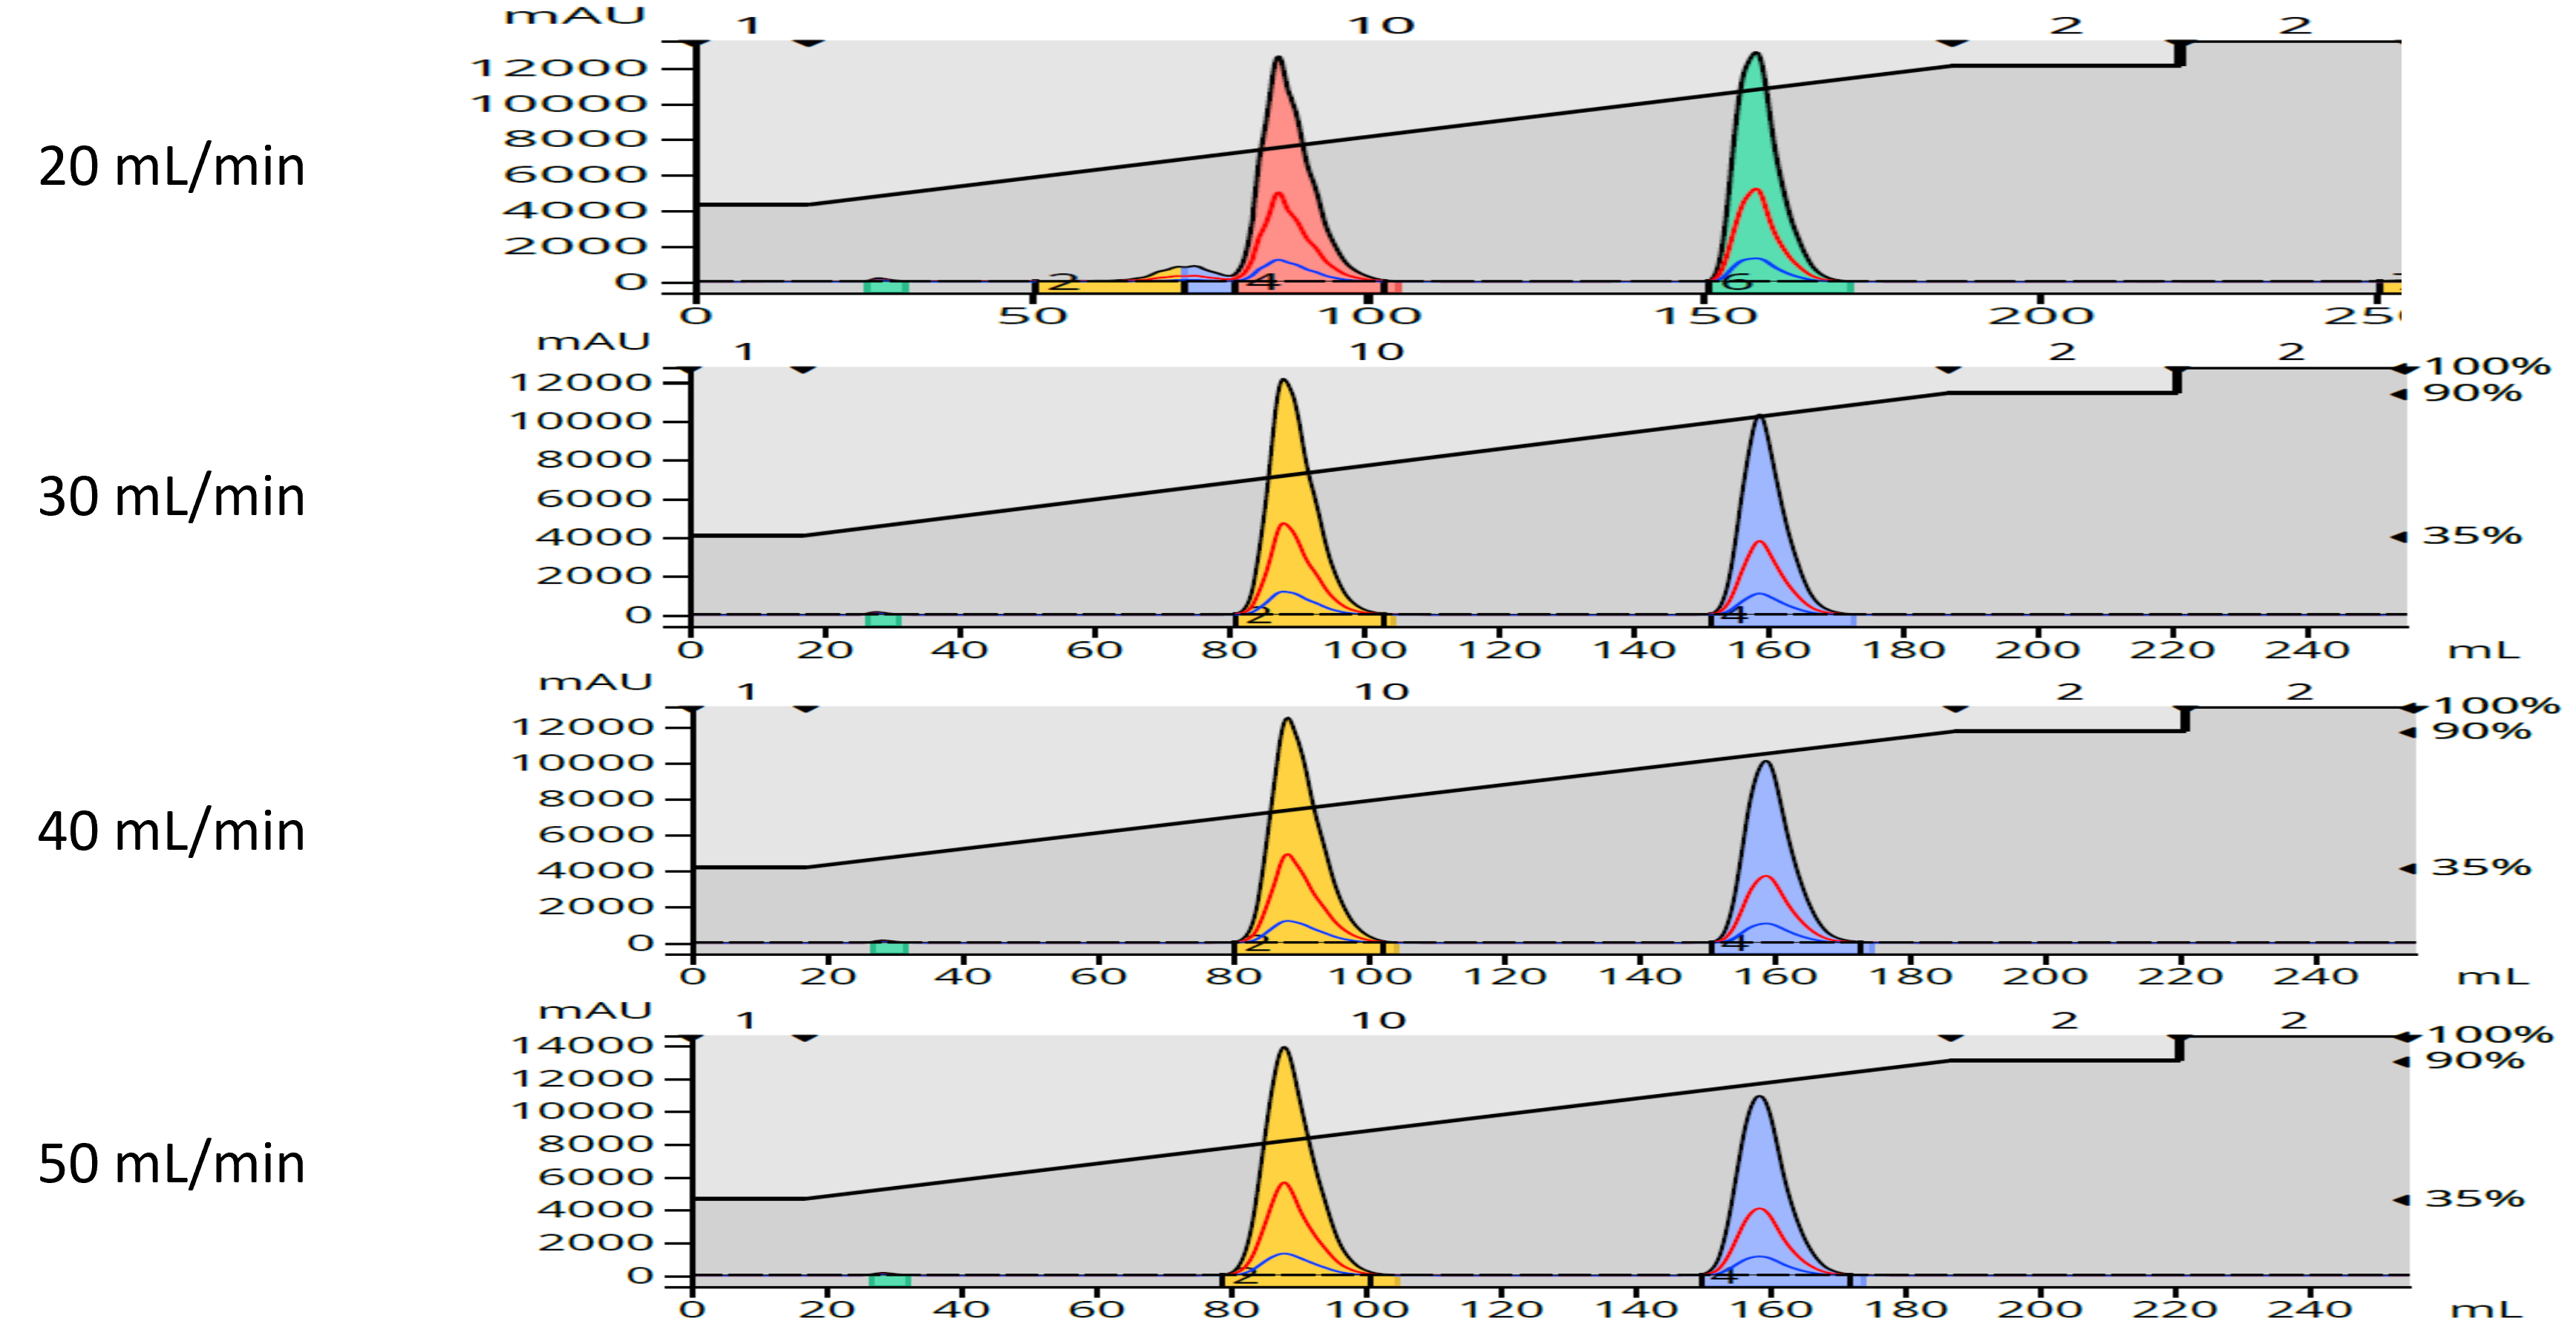
Figure 2. Impact of increasing flow rate on a binary component sample separation.
What is does show is that peak width decreased between 20 and 30 mL/min, especially for the first eluting compound. Though hard to see in the chromatograms, peak widths did increase at both 40 and 50 mL/min. This data is expressed in terms of height equivalent to a theoretical plate or HETP, which is a measure of peak width at a specific peak retention time or volume, Table 1.
Table 1. Impact of flow rate on HETP (Height Equivalent to a Theoretical Plate). Lower numbers equal better performance.

Plotted as in Figure 1, the data show the optimal flow rate to be 30 mL/min, Figure 3. However, in this instance, performing the separation at 50 mL/min has no negative impact and speeds the purification. More challenging purifications, however, will greatly benefit from operating at the optimal flow rate, especially when there is a need to scale-up the purification.
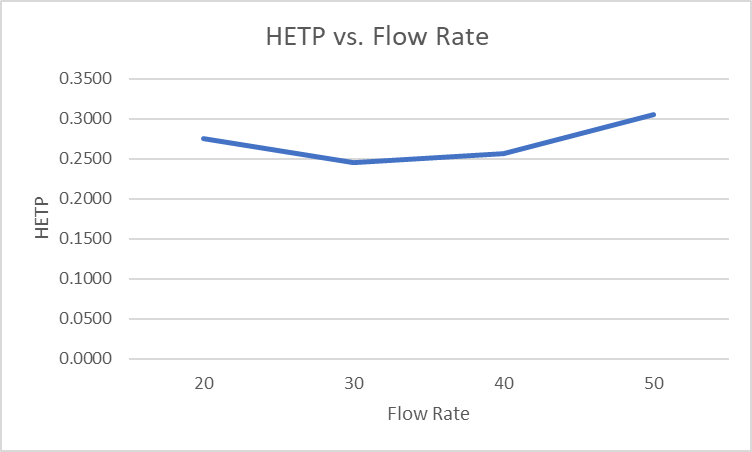
Figure 3. Flow rate impact on HETP, or separation efficiency. Lower values equal better performance.
So, how do you calculate linear velocity? Its quite simple just divide the column volume by flow rate then divide column length or bed depth by the value in the first calculation.
Equation 1. CV (mL)/FR (mL/min) = minutes
Equation 2. BD/minutes = mm/min
Keep this in mind when scaling up a purification, Table 2.
Table 2. Biotage® Sfär Column dimensions

If you are interested in learning more about flash chromatography, why not visit the blog site: