Flash chromatography gradients need to provide as good of a separation between the target compound at its closest eluting by-products as possible in order to maximize product purity and load. Many chemists create methods based on a history with a compound class, knowing what has worked in the past. If no history with a synthetic compound class exists, then methods need developing.
One method used by chemists is a simple 0-100% gradient of hexane and ethyl acetate. It is simple, but honestly, does not always provide the desired results. A case in point is the relatively simple separation of a mixture I use for training purposes which is a 1:1:1:1 mixture of naphthalene, 1-nitronaphthalene, 3,5-dibenzyloxyacetophenone, and ethyl paraben. The thin-layer chromatography (TLC) of this mixture in 20% ethyl acetate (EtOAc) in hexane shows that each compound is fully resolved from each other, Table 1.
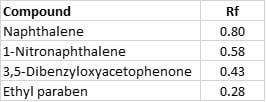
Table 1. Test mixture TLC Rf values in 20% EtOAc/hexane
When purified using a 0-100% linear gradient, the separation of the three retained compounds is compromised showing minimal separation even with excellent TLC data, Figure 1.
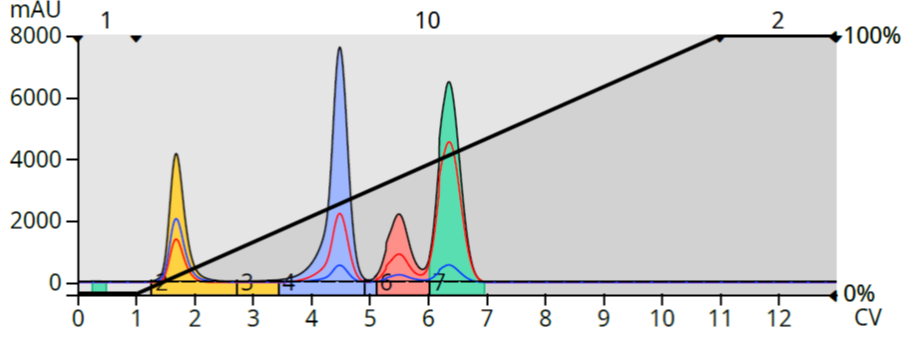
Figure 1. Test mix purified with a 10 CV, 0-100% EtOAc in hexane gradient. The steep gradient slope reduced the separation between peaks 2, 3, and 4.
Since this simple gradient doesn’t give the desired results, what will? Well, the nice thing about having TLC data is that it can be converted into a useful, more productive linear gradient. Flash systems such as the Biotage® Selekt, Selekt Enkel, and Isolera all have a TLC to linear gradient conversion function to automatically generate a gradient capable of eluting and separating every compound with an Rf greater than 0.1. When used for this test mixture, my Selekt system created a gradient starting at 5% EtOAc and ending at 40% EtOAc with a length of 10 column volumes (CV). This method provided a full separation of each compound in the mixture at the same sample load (~40 mg), Figure 2.
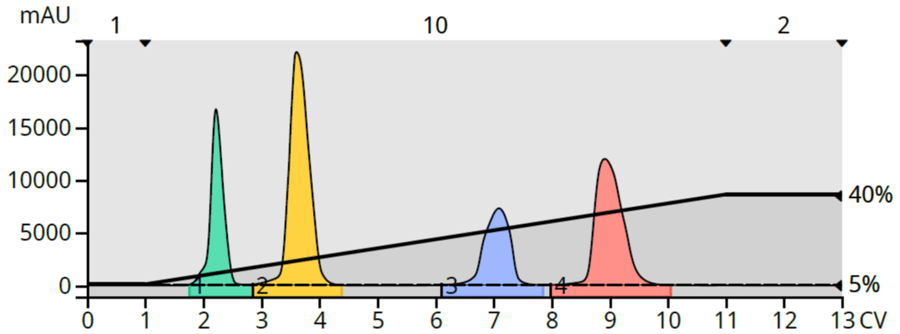
Figure 2. Test mixture purified using a TLC-based linear gradient provided full separation of all compounds.
So, this result is really good, but can it be made shorter to save time and solvent? The TLC based method consumed 117 mL of solvent (5-gram Biotage Sfär HC column) and required 6.2 minutes at 18 mL/min to perform. Although the solvent used and time required are low, I experimented with changing the gradient’s slope and duration to see if it could be improved.
- 5-40% in 5 CV
- 5-60% in 5 CV
- 5-80% in 5 CV
With each of these methods I kept both the initial 1 CV 5% isocratic segment at the start of the method and the 2 CV isocratic segment at the end of the gradient as these help in ensuring both compound retention and elution, resp.
What happened with these modifications is shown in Figure 3. As gradient slope increased, compound retention and separation decreased which makes sense when you look at the original 0-100% gradient over 10 CV or 10%/CV.
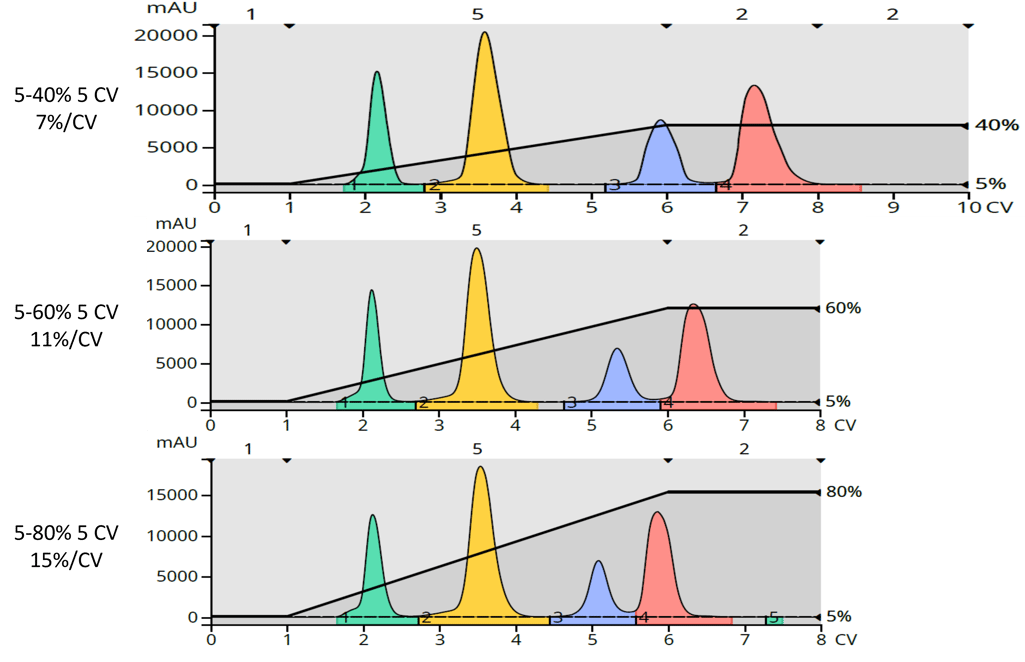
Figure 3. Test mixture purification using gradients with increasing slope. Top - 7% EtOAc/CV. Middle - 11% EtOAc/CV. Bottom - 15% EtOAc/CV.
Interestingly, the separation of the first two compounds does not change with increasing slope; each compound maintains its retention. However, it is the two more polar compounds with the lower Rf values that are impacted most, especially with the 10 CV 0-100% gradient! This very likely is due to the gradient delay when forming a gradient with a small volume column such as the 5 gram column used here. That is a topic for a future post.
With decreasing retention comes reduced resolution, which is key for maximizing load and purity. Visually, you can see this in the data where the amount of separation between the benzyloxyacetophenone and paraben (last 2 peaks) decreases with increasing slope.
Resolution can also be calculated, if that is important to you, using the following equation.
Rs = 2(V2-V1)/(W1+W2)
Where:
Rs = resolution
V1 = elution volume for the earlier peak
V2 = elution volume for the later peak
W1 = the peak width for the earlier peak
W2 = the peak width for the later compound
Resolution calculations are in Table 2.
Table 2. Gradient resolution calculations
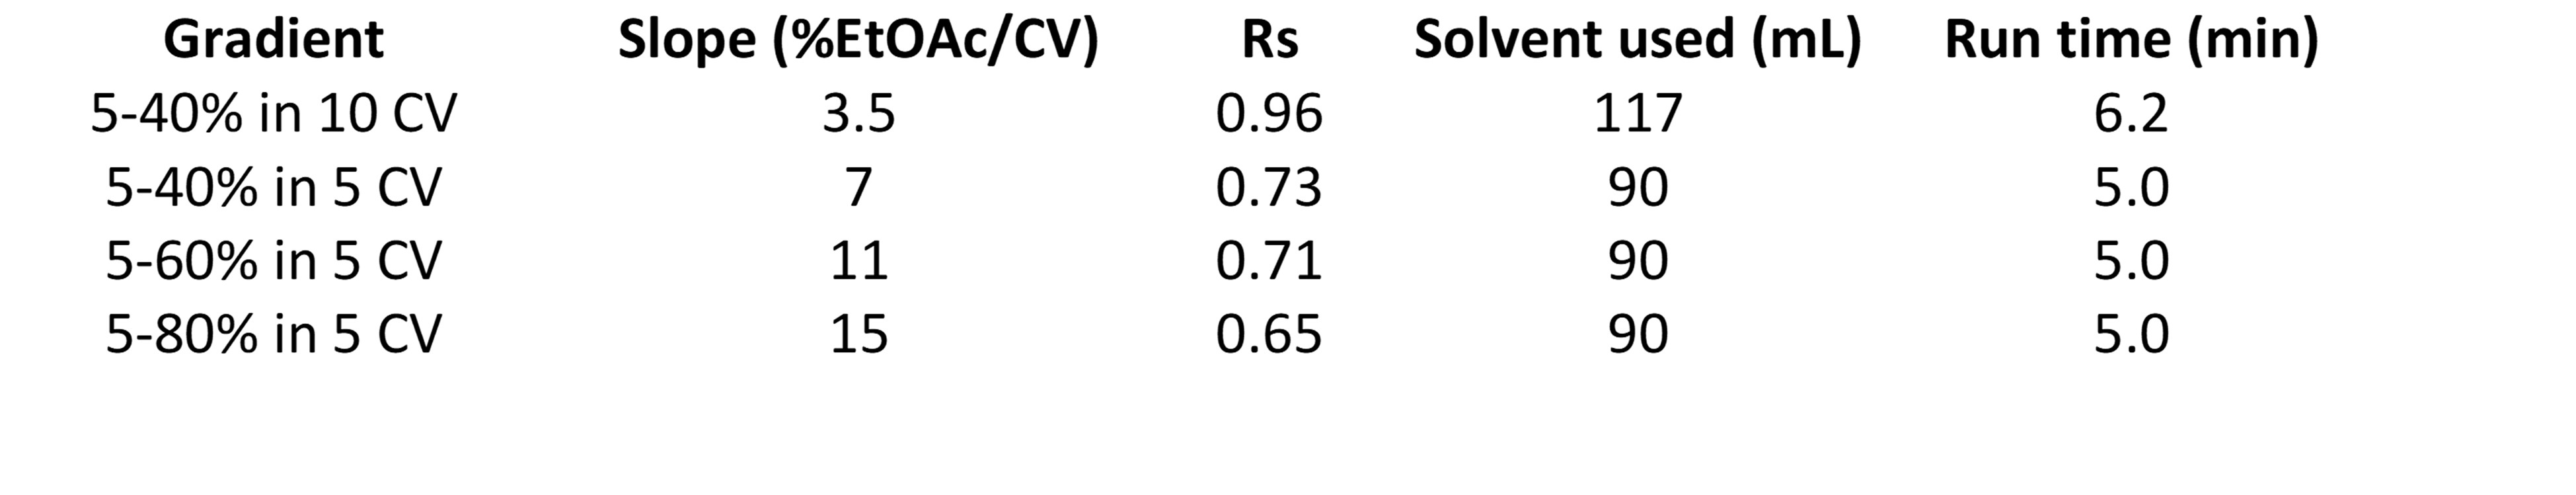
In fact, between the TLC-based, 10 CV, 5-40% EtOAc gradient and the 5 CV, 5-80% gradient, resolution decreased 32%, which will negatively impact both loading capacity and target product purity. There is, however, a benefit to these shorter methods - solvent and time savings. Solvent consumption dropped 23% and purification time reduced by 20% compared to the 10 CV method.
So, how should you make your gradient? Well, to maximize load and purity, use your system’s TLC to linear gradient feature. While it uses a bit more solvent and takes a little longer, your results will be better.
Interested in learning more about flash chromatography? Check our this whitepaper – Inspiring Productivity with Modern Flash Chromatography