 Organic Workflow
 Peptide Workflow
 Scale-Up Flash Purification
  Sample Preparation
 Biomolecule Purification
 Oligo synthesis
 Scavengers and Reagents
 Service & Support
 Accessories & Spare parts
 Investors
 Reports & News
 The Share
 Corporate Governance
 Calendar
 Sustainability
 Our Offering
 Our History
 Our Locations
 Leadership
A question I hear a lot from chemists is “how much can I load”. The answer is always “it depends on your separation quality”. At that point I begin asking about the TLC data and purification goals. Purification goal setting should be your first step and the question to answer is – what do I need this purification to achieve? Is the goal high purity, high yield, or some combination. Remember, you will typically sacrifice purity for high yield and yield for high purity so optimization is an important consideration.
In this post I will discuss the results of a study I conducted where I continually increased the crude sample load until my target compound purity fell below specific targeted levels to understand the real loading limitation.
In previous posts I have addressed this loading topic from the perspective of method optimization. Besides optimizing the gradient, choosing the most effective sample loading method is critical. Clearly, when a separation method and loading technique used do not generate a targeted yield and purity levels for your target molecule, they should not be used.
In my study I prepared a 5-component sample with each chemical accounting for 20% (by weight) of the total. I dissolved the five compounds in acetone to a final concentration of ~ 0.67 g/mL. My purification goal was 90%+ for my targeted product. A secondary goal was to maximize yield and conserve solvent.
In order to determine the best separation conditions, I ran TLC with two different ethyl acetate in hexane blends (20% and 30%) and calculated the Rf values for each, Table 1. The reason I ran two TLC plates with different solvent strengths is because I know I can use this data to create a step gradient. Why a step gradient? Because step gradients provide higher sample loads, typically, compared to linear gradients and consume less solvent – more on that later.
I also opted for dry loading over liquid loading for the same reasons as above – higher loading capacity. Injection solvents can, and usually will, negatively impact the purification, so I usually recommend dry loading.
| Compound | 20% EtOAc | 20% EtOAc | 30% EtOAc | 30% EtOAc |
| Migration (mm) | Rf | Migration (mm) | Rf | |
| Compound 1 | 45 | 0.83 | 44 | 0.85 |
| Compound 2 | 28 | 0.52 | 31 | 0.6 |
| Compound 3 | 22 | 0.41 | 27 | 0.52 |
| Compound 4 | 13 | 0.24 | 18 | 0.35 |
| Compound 5 | 10 | 0.19 | 14 | 0.27 |
| Solvent | 54 | 52 |
Table 1. TLC data
For my mix, a 90%+ purity target with a yield of >70 mg for compound 4 was needed. From my TLC data, a linear gradient based on 20% ethyl acetate predicted a load of 234 mg (Figure 1) while a step gradient based on 20% and 30% ethyl acetate predicted 421 mg (Figure 2). So, based on my goals and the TLC data, I chose the step gradient and a 10 gram high performance silica cartridge (Biotage® SNAP Ultra). To get the same load, and therefore the same yield and purity with the linear gradient, a 25 gram cartridge or two separate purifications on 10 gram cartridges are required. Preparative chromatography does not need to be pretty to be effective, depending on your goals. Loading at the predicted mass amount or even slightly higher can reap benefits in product yield though with some loss in purity. Overloading to excess, though, has minimal benefit unless your targeted compounds exist in very small amounts – e.g. metabolites. This is why you need to set your purification goals first.
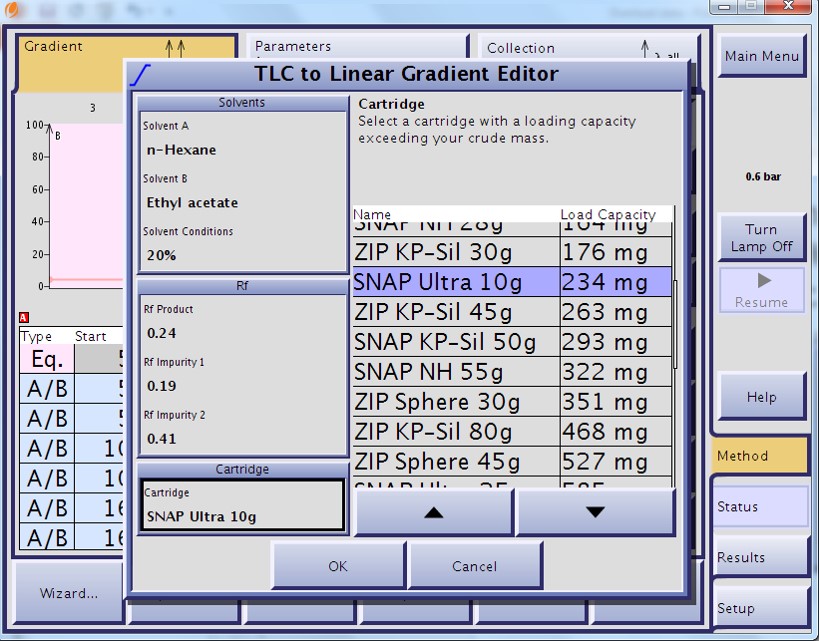
Figure 1. TLC-based load prediction for a linear gradient using a 10 gram high performance silica cartridge using a TLC solvent mixture of 20% EtOAc in hexanes. The load estimation based on the Rf values is 234 mg or approximately 2% of the silica amount.
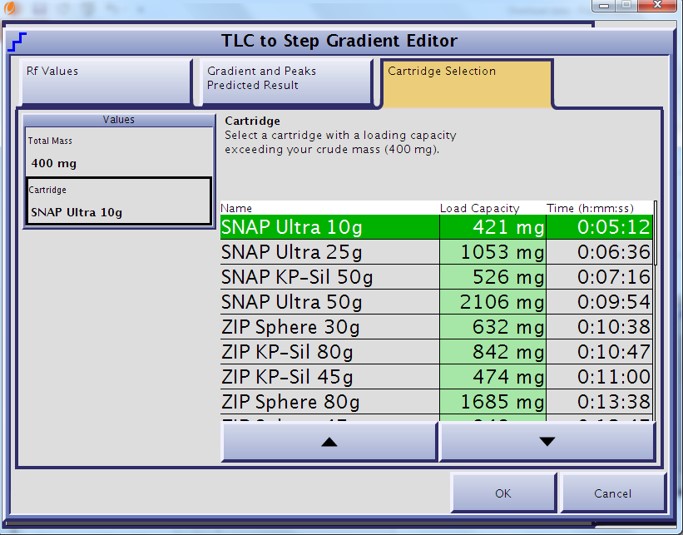
Figure 2. TLC-based step gradient load estimation for a 10 gram high performance flash cartridge. Two TLC plates were developed, one at 20% EtOAc in hexanes and the other at 30% EtOAc in hexanes. Using this methodology the load capacity for the 10 gram cartridge is almost double that of the linear gradient.
However, for the sake of comparison I did run the linear gradient. Using the information from the TLC to linear gradient model I purified my sample at a 2% load (~200 mg) on the 10 gram high-performance flash cartridge, Figure 3. The separation is quite good but at half the load of what I needed. To achieve my yield goal I would have needed to purify another 200 mg consuming another 221 mL (not including equilibration) as well as another flash cartridge.
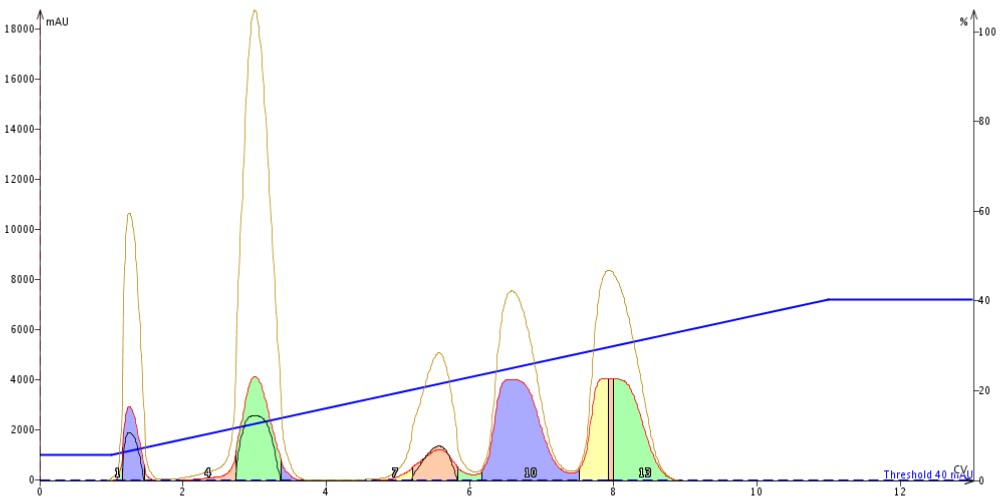 Figure 3. Results of 2% load (200 mg) of a 5-component mixture purification using a linear 5-40% gradient and a 10 gram high-performance flash cartridge. The separation is good but insufficient for the goals set for the purification.
At a 4% load (400 mg) using the step gradient the separation was even better than the linear gradient (even at twice the load!). My targeted compound eluted in fractions 10-12 and looked fully resolved from its nearest neighbors, Figure 4.
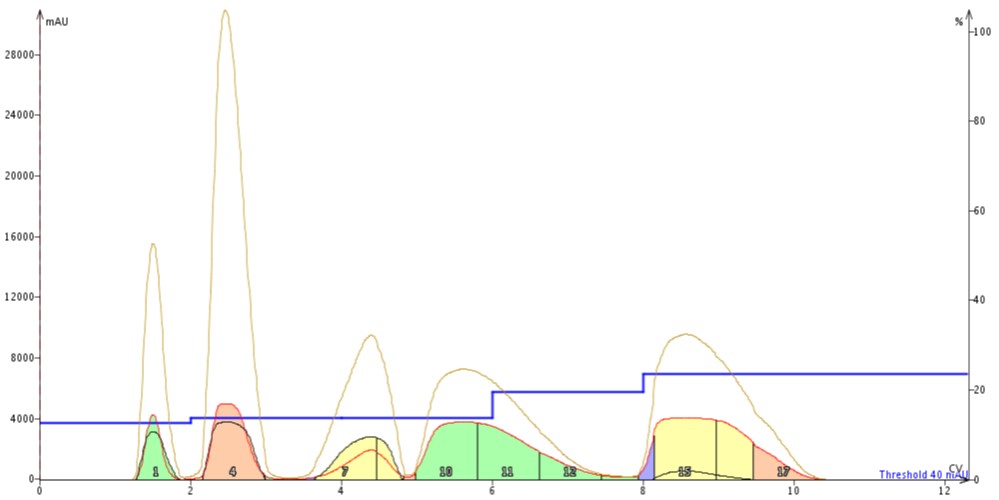
Figure 4. Step gradient separation of a 5-component mixture (400 mg) on a 10 gram high-performance flash cartridge (4% sample load). The separation achieved is improved compared to the linear gradient even a twice the load.
To determine peak purity I analyzed the fractions by TLC, Figure 5. The fractions of interest (10, 11, and 12) showed no impurities indicating a high purity level. Each of the peaks' fractions were pooled and evaporated into pre-tared 20 mL scintillation vials to determine yield, Table 2.
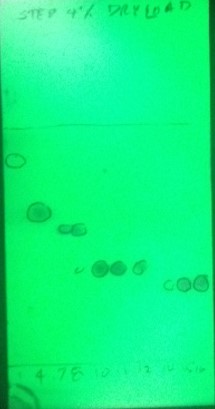
Figure 5. TLC analysis of 4% load purification show the targeted product fractions (10, 11, 12) to be pure.
| Peak 1 | Peak 2 | Peak 3 | Peak 4 | Peak 5 | |
| (Fraction 1) | (Fraction 4) | (Fractions 7, 8) | (Fractions 10-12) | (Fractions 14-17) | |
| Weight (g) | 13.0317 | 12.9211 | 13.0937 | 12.919 | 12.9418 |
| Tare (g) | 12.9892 | 12.8381 | 13.0244 | 12.8384 | 12.8609 |
| Net (g) | 0.0425 | 0.083 | 0.0683 | 0.0806 | 0.0809 |
Table 2. Post-purification purity analysis data
Have you ever needed to push your flash chromatography to its limits?The results in Table 2 show that I was able to achieve my goals of 90%+ purity and a yield of >70 mg for peak 4. By choosing a step gradient I pushed the load limits of a silica cartridge and achieved my goals.
Interested in learning more about flash chromatography? If so, please download our white paper Successful Flash Chromatography.