 Organic Workflow
 Peptide Workflow
 Scale-Up Flash Purification
  Sample Preparation
 Biomolecule Purification
 Oligo synthesis
 Scavengers and Reagents
 Service & Support
 Accessories & Spare parts
 Investors
 Reports & News
 The Share
 Corporate Governance
 Calendar
 Sustainability
 Our Offering
 Our History
 Our Locations
 Leadership
For many synthetic chemists the primary purification goal is to isolate as much synthetic product as possible with a minimum of 80% purity. The go-to technique for product isolation is flash purification (flash chromatography), especially for intermediates.
Most flash chromatography is performed using normal-phase (silica column with lipophilic solvents). Useful and efficient flash chromatography methods can be created using thin-layer chromatography (TLC) though many chemists will use either an educated guess or a with a method known to work for their types of molecules.
When normal-phase does not work, reversed-phase flash chromatography typically will. Method development and optimization, however, cannot typically be achieved using TLC. Chemists utilizing reversed-phase flash chromatography can use their HPLC analysis method reprogrammed on their flash system for purification. This is an excellent starting point but may not provide an optimal separation and therefore non-optimal loading capacity.
I have previously posted on reversed-phase method development options including the use of a scaling column for method development/optimization using an HPLC. Since scaling columns from Biotage are packed with the same media used in their flash columns, separation selectivity is maintained which enhances to likelihood of purification success.
There are several variables which impact a successful purification including…
- -Stationary phase selection
- -Sample solubility in the mobile phase
- -Selectivity between the target compound and its nearest neighbors
- -Compound retention
- -Gradient duration
- -Gradient slope
In this post I will focus on gradient slope which can dramatically influence loading capacity. To illustrate this, I ran a series of purifications using a 12-gram Biotage® Sfär C18 column and a Biotage® Selekt flash system with a synthetic microwave (Biotage® Initiator+) reaction product, Figure 1.
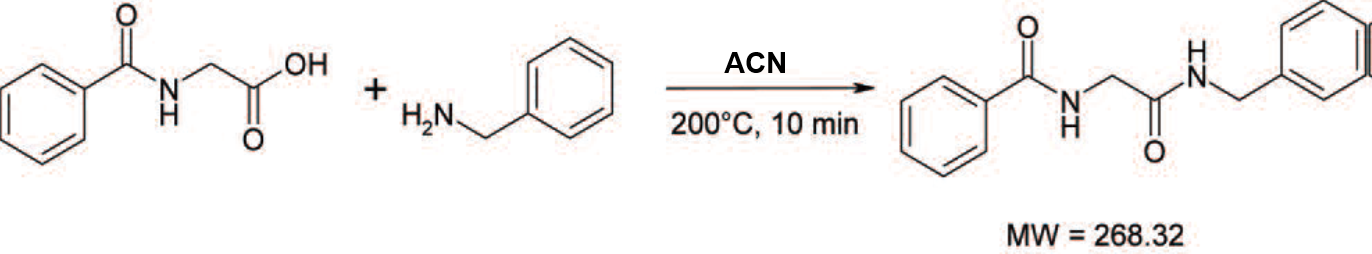
Figure 1. Reaction of hippuric acid and benzyl amine in acetonitrile.
This reaction is quite efficient at creating the target product. However, flash chromatography with a generic 25-75% acetonitrile/water gradient over 10 column volumes (CV), shows the presence of five impurities, one which elutes right after the product which will influence our loading capacity and product purity, Figure 2.
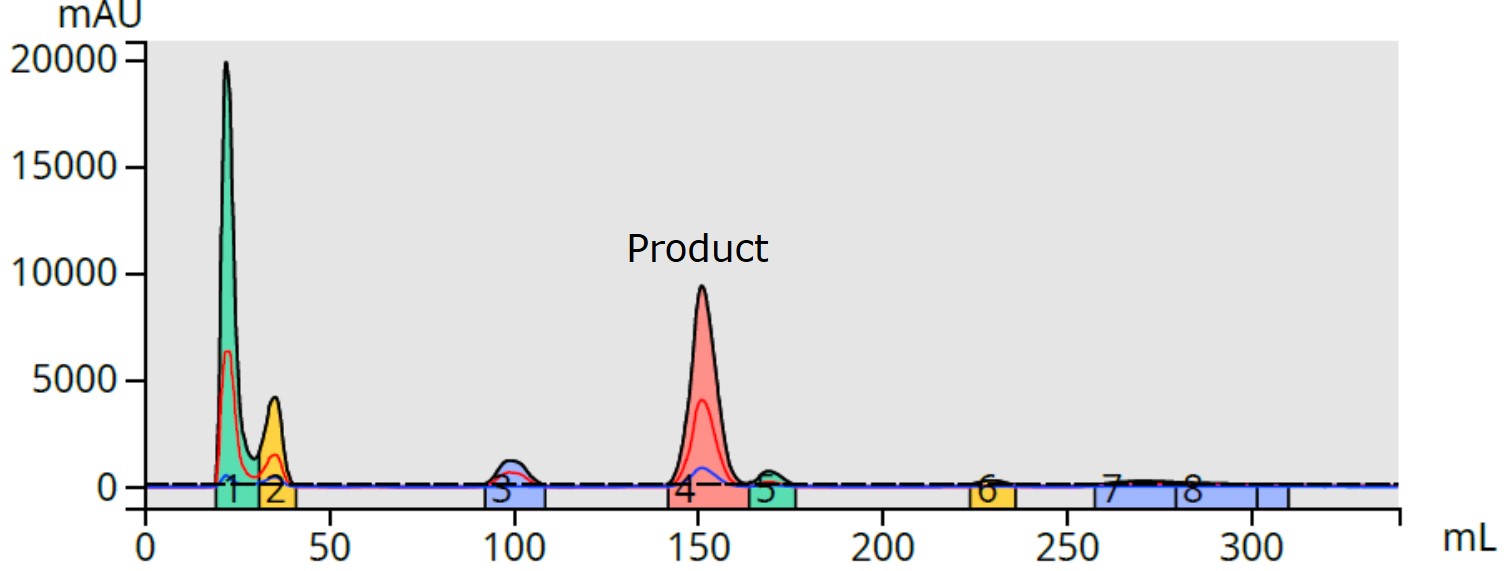
Figure 2. Generic 25-75% ACN in 10 CV gradient purification of the reaction mixture (16 mg load) shows a by-product (fraction 5) eluting just after the product (fraction 4).
I like starting my reversed-phase gradients with this gradient slope (5%/CV) as it usually provides sufficient data to make optimization decisions. From here, adjustments can be made to either increase or decrease slope to improve the resolution between the product and its nearest eluting by-products.
Resolution, the amount of separation between adjacent eluting peaks, is one of the major factors in determining loading capacity. To optimize resolution, you can change separation selectivity, column efficiency, and/or gradient slope.
With reversed-phase, selectivity changes are possible but difficult. Sometimes, changing the organic solvent from acetonitrile to methanol (or vice versa) can do the job. Sometimes changing column vendor will work.
Changing columns to one with a smaller media particle size will improve resolution as well but may not provide enough improvement. Gradient slope changes, however, can alter both selectivity and resolution by altering sample component mass-transfer partitioning kinetics.
In an attempt to improve resolution and loading capacity, I altered both gradient starting and ending points as well as slope. Experiments included acetonitrile/water gradients in Table 1.
Table 1. Gradients evaluated to improve purification
Start %B End %B Δ (%) Length (CV) Slope (%B/CV)
25 75 50 10 5.00
40 90 50 10 5.00
50 100 50 10 5.00
40 65 25 10 2.50
40 50 10 10 1.00
50 75 25 10 2.50
For this reaction mixture I found the shallowest gradient, 40-50% acetonitrile in 10 CV, provided the best separation and loading capacity, Figure 3. Sample loads for each experiment were kept to 16 mg (dissolved in DMSO).
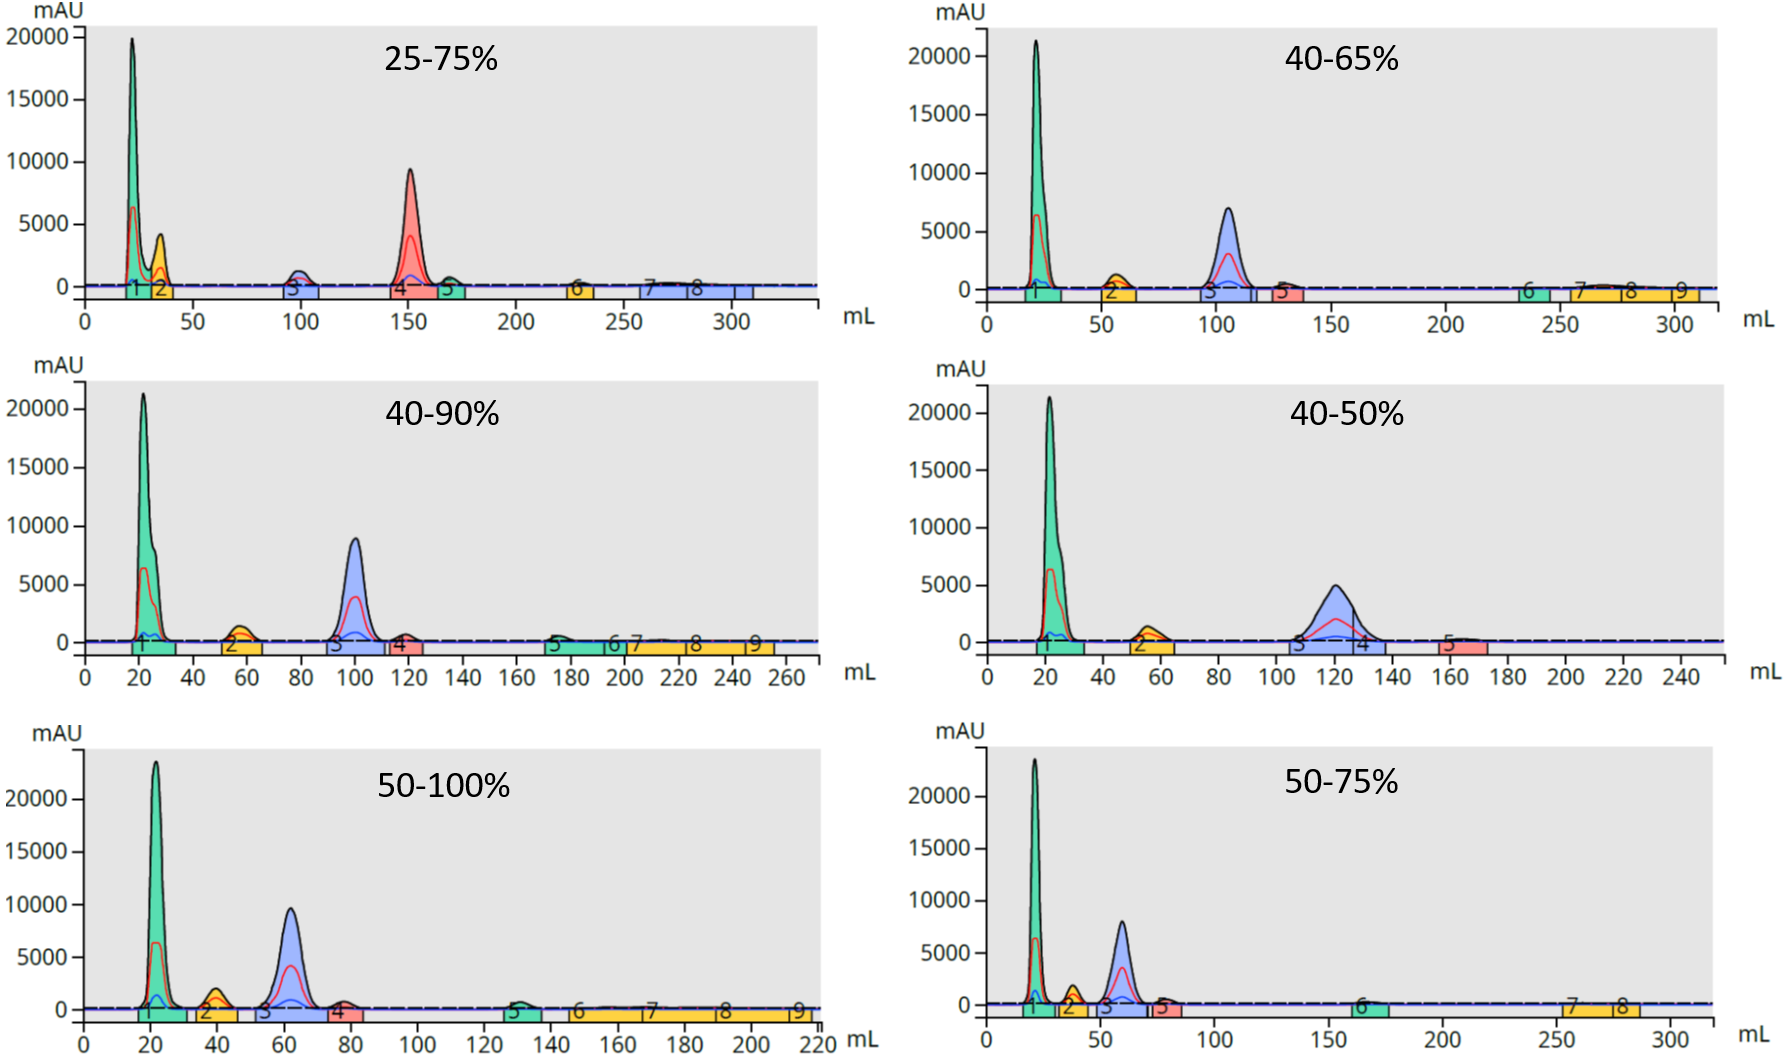
Figure 3. Gradient slope impact on the reaction mix separation. The best separation/resolution of the product from its nearest by-products was achieved with the 40-50% acetonitrile gradient.
With the steeper gradients, the trailing by-product is not as well resolved from the product as with the shallow 40-50% gradient, Table 2. The 40-50% gradient provided resolution of the product from the leading impurity of 3.45 and from the trailing impurity of 2.15. Shallow gradients like this, however, may not always be optimal.
Table 2. Resolution of the product from its leading and trailing by-products at different gradient slopes.
Start End Δ(%) Slope V0 V1 V2 V3 w1 w2 w3 Rs (1, Prod) Rs (Prod, 2)25 75 50 5.00 22.65 101 150 168 16 20 11 2.72 1.16
40 90 50 5.00 21.90 57.5 102 119 15 22 12 2.41 1.00
50 100 50 5.00 21.95 40 62.5 78 12 20 12 1.41 0.97
40 65 25 2.50 21.75 56. 105.5 131 15 24 13.5 2.51 1.36
40 50 10 1.00 21.75 55.5 121 164 15 23 17 3.45 2.15
50 75 25 2.50 21.60 38.2 60 79 12 22 12 1.28 1.12
Resolution is calculated from the difference in the elution volume (at peak apex) for the two peaks of interest divided by the sum of each peak’s width at baseline, Equation 1.
Equation 1. Resolution calculation
Rs = 2(V2-V1)/(W1+W2)
With increased resolution comes increased loading capacity. As previously mentioned, each of these experiments were conducted with a 16 mg load and for most, there was less than baseline resolution, which is 1.5, between the product and the trailing impurity.
By generating a resolution of 2.15 between the product and trailing by-product using the shallow gradient, the column's loading capacity for this reaction mixture purification improved 5x to 80 mg, Figure 4.
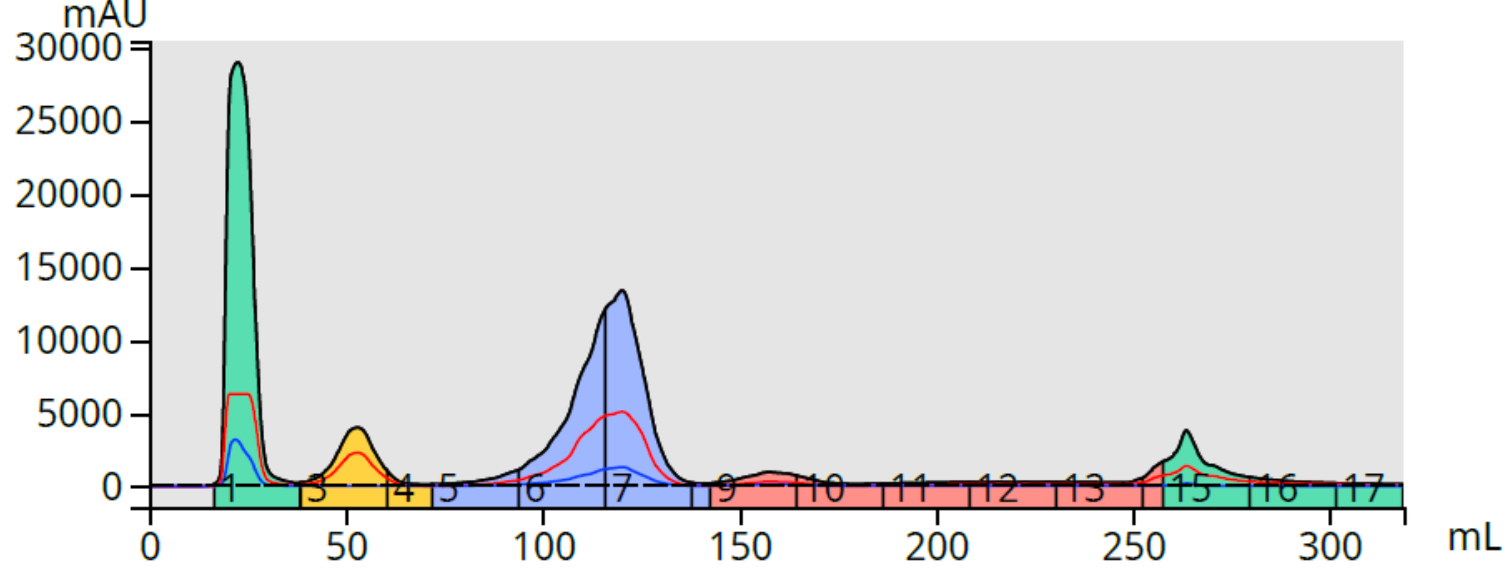
Figure 4. Reaction mixture purification (80 mg load) using the 40-50% acetonitrile gradient provides a complete separation of the product (blue peak) from both the leading and trailing by-products.
So, when optimizing your reversed-phase purification, try varying both gradient starting %B and gradient slope to maximize resolution. Though you can do this on your flash system like I have done, you will save solvent and sample by performing these experiments on an HPLC using a scaling column.
Interested in learning more? Download our instructional document - Biotage® Scaling Columns Tools for Flash Chromatography Method Development